The Bitcoin price edged up a fraction of a percent in the past 24 hours to trade at $86,640 as of 2:40 a.m. EST on [...]The Bitcoin price edged up a fraction of a percent in the past 24 hours to trade at $86,640 as of 2:40 a.m. EST on [...]

Bitcoin Price Pulls Back From $86K As Bloomberg Analyst Predicts $10K BTC, Peter Schiff Warns Of ‘Crash’

The Bitcoin price edged up a fraction of a percent in the past 24 hours to trade at $86,640 as of 2:40 a.m. EST on trading volume that dropped 11% to $44.8 billion.

This comes as BTC permabear Peter Schiff warned of a BTC crash, with money flowing back into traditional safe havens like gold and silver.

“The first casualty of the gold and silver surge will likely be Bitcoin,” Schiff said in an X post. ”Before a U.S. dollar crash, we will likely get a Bitcoin crash,”

Meanwhile, Bloomberg commodity strategist Mike McGlone says Bitcoin’s price could drop to $10,000.

McGlone says positive catalysts like the launch of spot Bitcoin ETFs, US leaders recognizing Bitcoin’s benefits, and broader mainstream adoption have all come to pass, suggesting the market will be short of future uplifting developments.

Meanwhile, US spot BTC ETFs have recorded their second day of outflows this week, with investors selling around 3,210 BTC worth around $277.2 million on Tuesday, according to Coinglass.

Bitcoin Price Faces Bearish Pressure After Losing Key Support

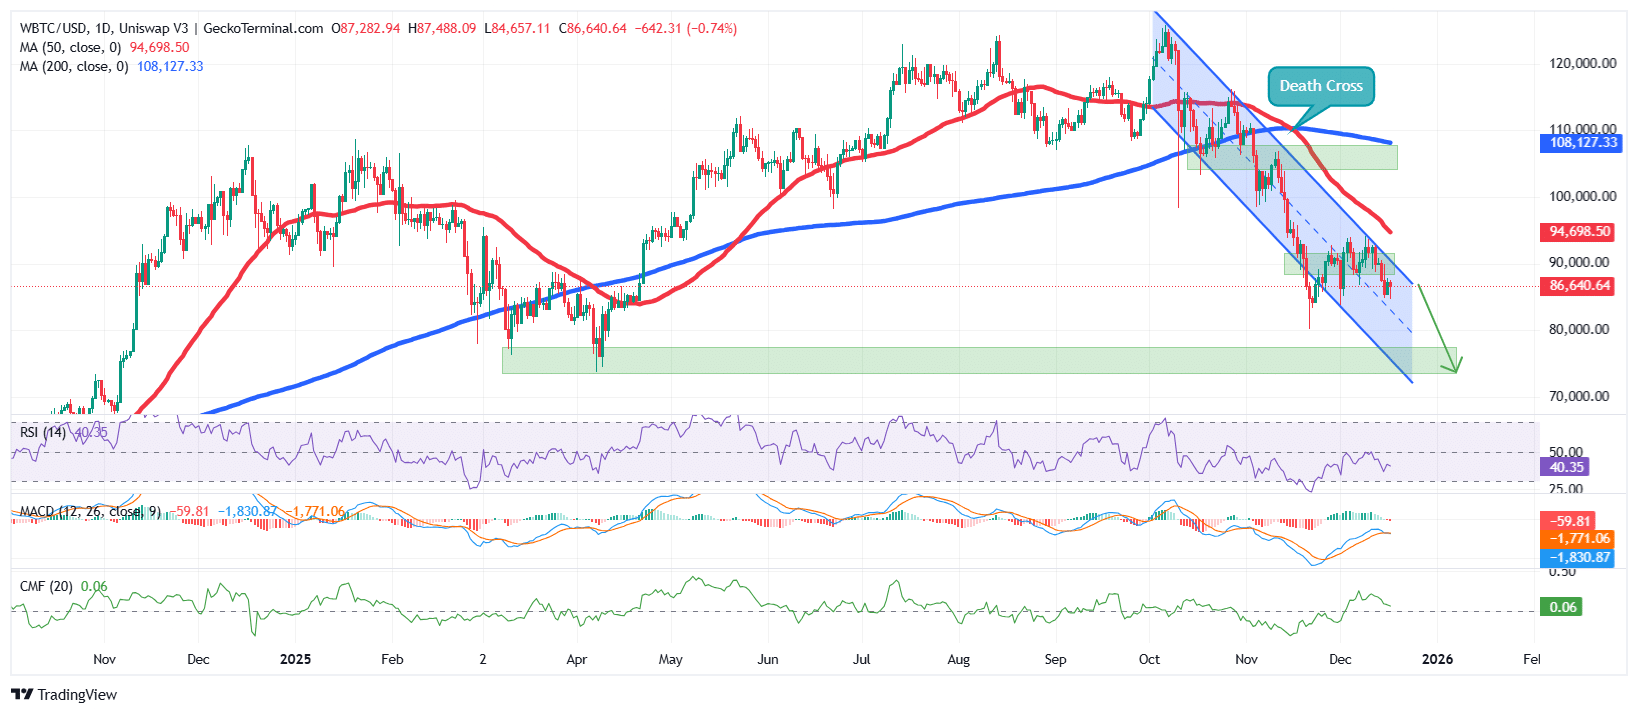
According to the BTC/USD chart analysis on the daily time frame, the BTC price is currently in a bearish falling channel pattern.

After touching an all-time high (ATH) around $126,200 in October, Bitcoin then corrected within the falling channel, as investors booked profits from the bullish surge from $74,000 in April to its ATH.

The sustained bearish pressure was further cemented by a death cross around $110,400, as the 200-day Simple Moving Average (SMA) crossed above the 50-day SMA.

This then pushed BTC’s price below both SMAs, supporting the long-term bearish stance.

BTC has now lost the $88,200 support area, which has been holding the price within a consolidation zone, capped by the $94,000 resistance area.

The Relative Strength Index (RSI) supports the bearish narrative, with the RSI now dropping towards the 30-oversold level, currently at 40, and continuing to decline.

Moreover, the blue Moving Average Convergence Divergence (MACD) line has crossed below the orange signal line, and the red histogram bars are now forming below the neutral line, signaling that Bitcoin’s price has lost momentum.

BTC/USD Chart Analysis Source: GeckoTerminalBTC/USD Chart Analysis Source: GeckoTerminal

BTC Price Prediction

Based on the BTC price analysis, the asset has turned bearish after losing support at $88,200. With the negative RSI and MACD indicators, BTC could continue to drop, with the next key support around $74,200 in the long term.

Ali Martinez, a prominent crypto analyst on X, says the SuperTrend indicator has flipped to sell, suggesting Bitcoin’s price may slide even further, based on historical data.

Conversely, if bulls defend the $85,000 area, Bitcoin could surge, with the 50-day SMA at $94,698 acting as the immediate target and resistance zone.

The bullish case could be supported by the Chaikin Money Flow (CMF), which is slightly positive, suggesting a mild capital inflow and indicating that buyers are still present but without firm conviction, suggesting weak accumulation rather than a strong bullish push.

Market Opportunity
Bitcoin Logo
Bitcoin Price(BTC)
$88,290.67
$88,290.67$88,290.67
-0.25%
USD
Bitcoin (BTC) Live Price Chart
Disclaimer: The articles reposted on this site are sourced from public platforms and are provided for informational purposes only. They do not necessarily reflect the views of MEXC. All rights remain with the original authors. If you believe any content infringes on third-party rights, please contact [email protected] for removal. MEXC makes no guarantees regarding the accuracy, completeness, or timeliness of the content and is not responsible for any actions taken based on the information provided. The content does not constitute financial, legal, or other professional advice, nor should it be considered a recommendation or endorsement by MEXC.

You May Also Like

REX Shares’ Solana staking ETF sees $10M inflows, AUM tops $289M for first time

REX Shares’ Solana staking ETF sees $10M inflows, AUM tops $289M for first time

The post REX Shares’ Solana staking ETF sees $10M inflows, AUM tops $289M for first time appeared on BitcoinEthereumNews.com. Key Takeaways REX Shares’ Solana staking ETF saw $10 million in inflows in one day. Total inflows over the past three days amount to $23 million. REX Shares’ Solana staking ETF recorded $10 million in inflows yesterday, bringing total additions to $23 million over the past three days. The fund’s assets under management climbed above $289.0 million for the first time. The SSK ETF is the first U.S. exchange-traded fund focused on Solana staking. Source: https://cryptobriefing.com/rex-shares-solana-staking-etf-aum-289m/
Share
BitcoinEthereumNews2025/09/18 02:34
Microsoft Corp. $MSFT blue box area offers a buying opportunity

Microsoft Corp. $MSFT blue box area offers a buying opportunity

The post Microsoft Corp. $MSFT blue box area offers a buying opportunity appeared on BitcoinEthereumNews.com. In today’s article, we’ll examine the recent performance of Microsoft Corp. ($MSFT) through the lens of Elliott Wave Theory. We’ll review how the rally from the April 07, 2025 low unfolded as a 5-wave impulse followed by a 3-swing correction (ABC) and discuss our forecast for the next move. Let’s dive into the structure and expectations for this stock. Five wave impulse structure + ABC + WXY correction $MSFT 8H Elliott Wave chart 9.04.2025 In the 8-hour Elliott Wave count from Sep 04, 2025, we saw that $MSFT completed a 5-wave impulsive cycle at red III. As expected, this initial wave prompted a pullback. We anticipated this pullback to unfold in 3 swings and find buyers in the equal legs area between $497.02 and $471.06 This setup aligns with a typical Elliott Wave correction pattern (ABC), in which the market pauses briefly before resuming its primary trend. $MSFT 8H Elliott Wave chart 7.14.2025 The update, 10 days later, shows the stock finding support from the equal legs area as predicted allowing traders to get risk free. The stock is expected to bounce towards 525 – 532 before deciding if the bounce is a connector or the next leg higher. A break into new ATHs will confirm the latter and can see it trade higher towards 570 – 593 area. Until then, traders should get risk free and protect their capital in case of a WXY double correction. Conclusion In conclusion, our Elliott Wave analysis of Microsoft Corp. ($MSFT) suggested that it remains supported against April 07, 2025 lows and bounce from the blue box area. In the meantime, keep an eye out for any corrective pullbacks that may offer entry opportunities. By applying Elliott Wave Theory, traders can better anticipate the structure of upcoming moves and enhance risk management in volatile markets. Source: https://www.fxstreet.com/news/microsoft-corp-msft-blue-box-area-offers-a-buying-opportunity-202509171323
Share
BitcoinEthereumNews2025/09/18 03:50
The Digital WOW Explains How AI Is Affecting Digital Marketing

The Digital WOW Explains How AI Is Affecting Digital Marketing

WEST PALM BEACH, Fla., Dec. 19, 2025 /PRNewswire/ — The Digital WOW, powered by ConsultPR.net, announces new findings on how AI is affecting digital marketing.
Share
AI Journal2025/12/19 17:30