Pepe Coin price has continued its freefall since May this year, and this trend may accelerate as whales begin to capitulate.Pepe Coin price has continued its freefall since May this year, and this trend may accelerate as whales begin to capitulate.

Pepe Coin price eyes 30% dip as whales start capitulating

Pepe Coin price has continued its freefall since May this year, and this trend may accelerate as whales begin to capitulate. 

Summary
  • Pepe Coin price continued its freefall this week.
  • Whales and smart money investors have dumped their tokens.
  • The supply of Pepe tokens in exchanges has continued rising.

Pepe (PEPE) token fell to a low of $0.000003745, its lowest level since Oct. 10, and about 78% below its highest point in May this year. 

On-chain data shows that whales have started capitulating in the past few days. Whales hold 4.51 trillion Pepe tokens, down from this month’s high of 4.51 trillion. This selling could be a sign of capitulation, as the coin has continued making a series of lower lows. 

The selling could be a sign of increasing weariness ahead of the closely-watched Bank of Japan interest rate decision. Economists expect the bank to raise interest rates by 0.25% to 0.75%, a move that may increase volatility in the cryptocurrency market. 

More data shows that smart money investors have reduced their positions from 211 billion tokens in November to 209 billion. This is important because these investors are known to execute mostly profitable trades.

These activities have coincided with the slow rebound of exchange supply. There are now 265.81 trillion tokens, up from this month’s low of 203 billion. A rising exchange balance indicates increased selling by investors. 

Meanwhile, the token’s futures open interest has dropped in the past few months. Its funding rate has remained in the neutral phase as its liquidity continues to fall.

Pepe Coin price technical analysis 

pepe coin price

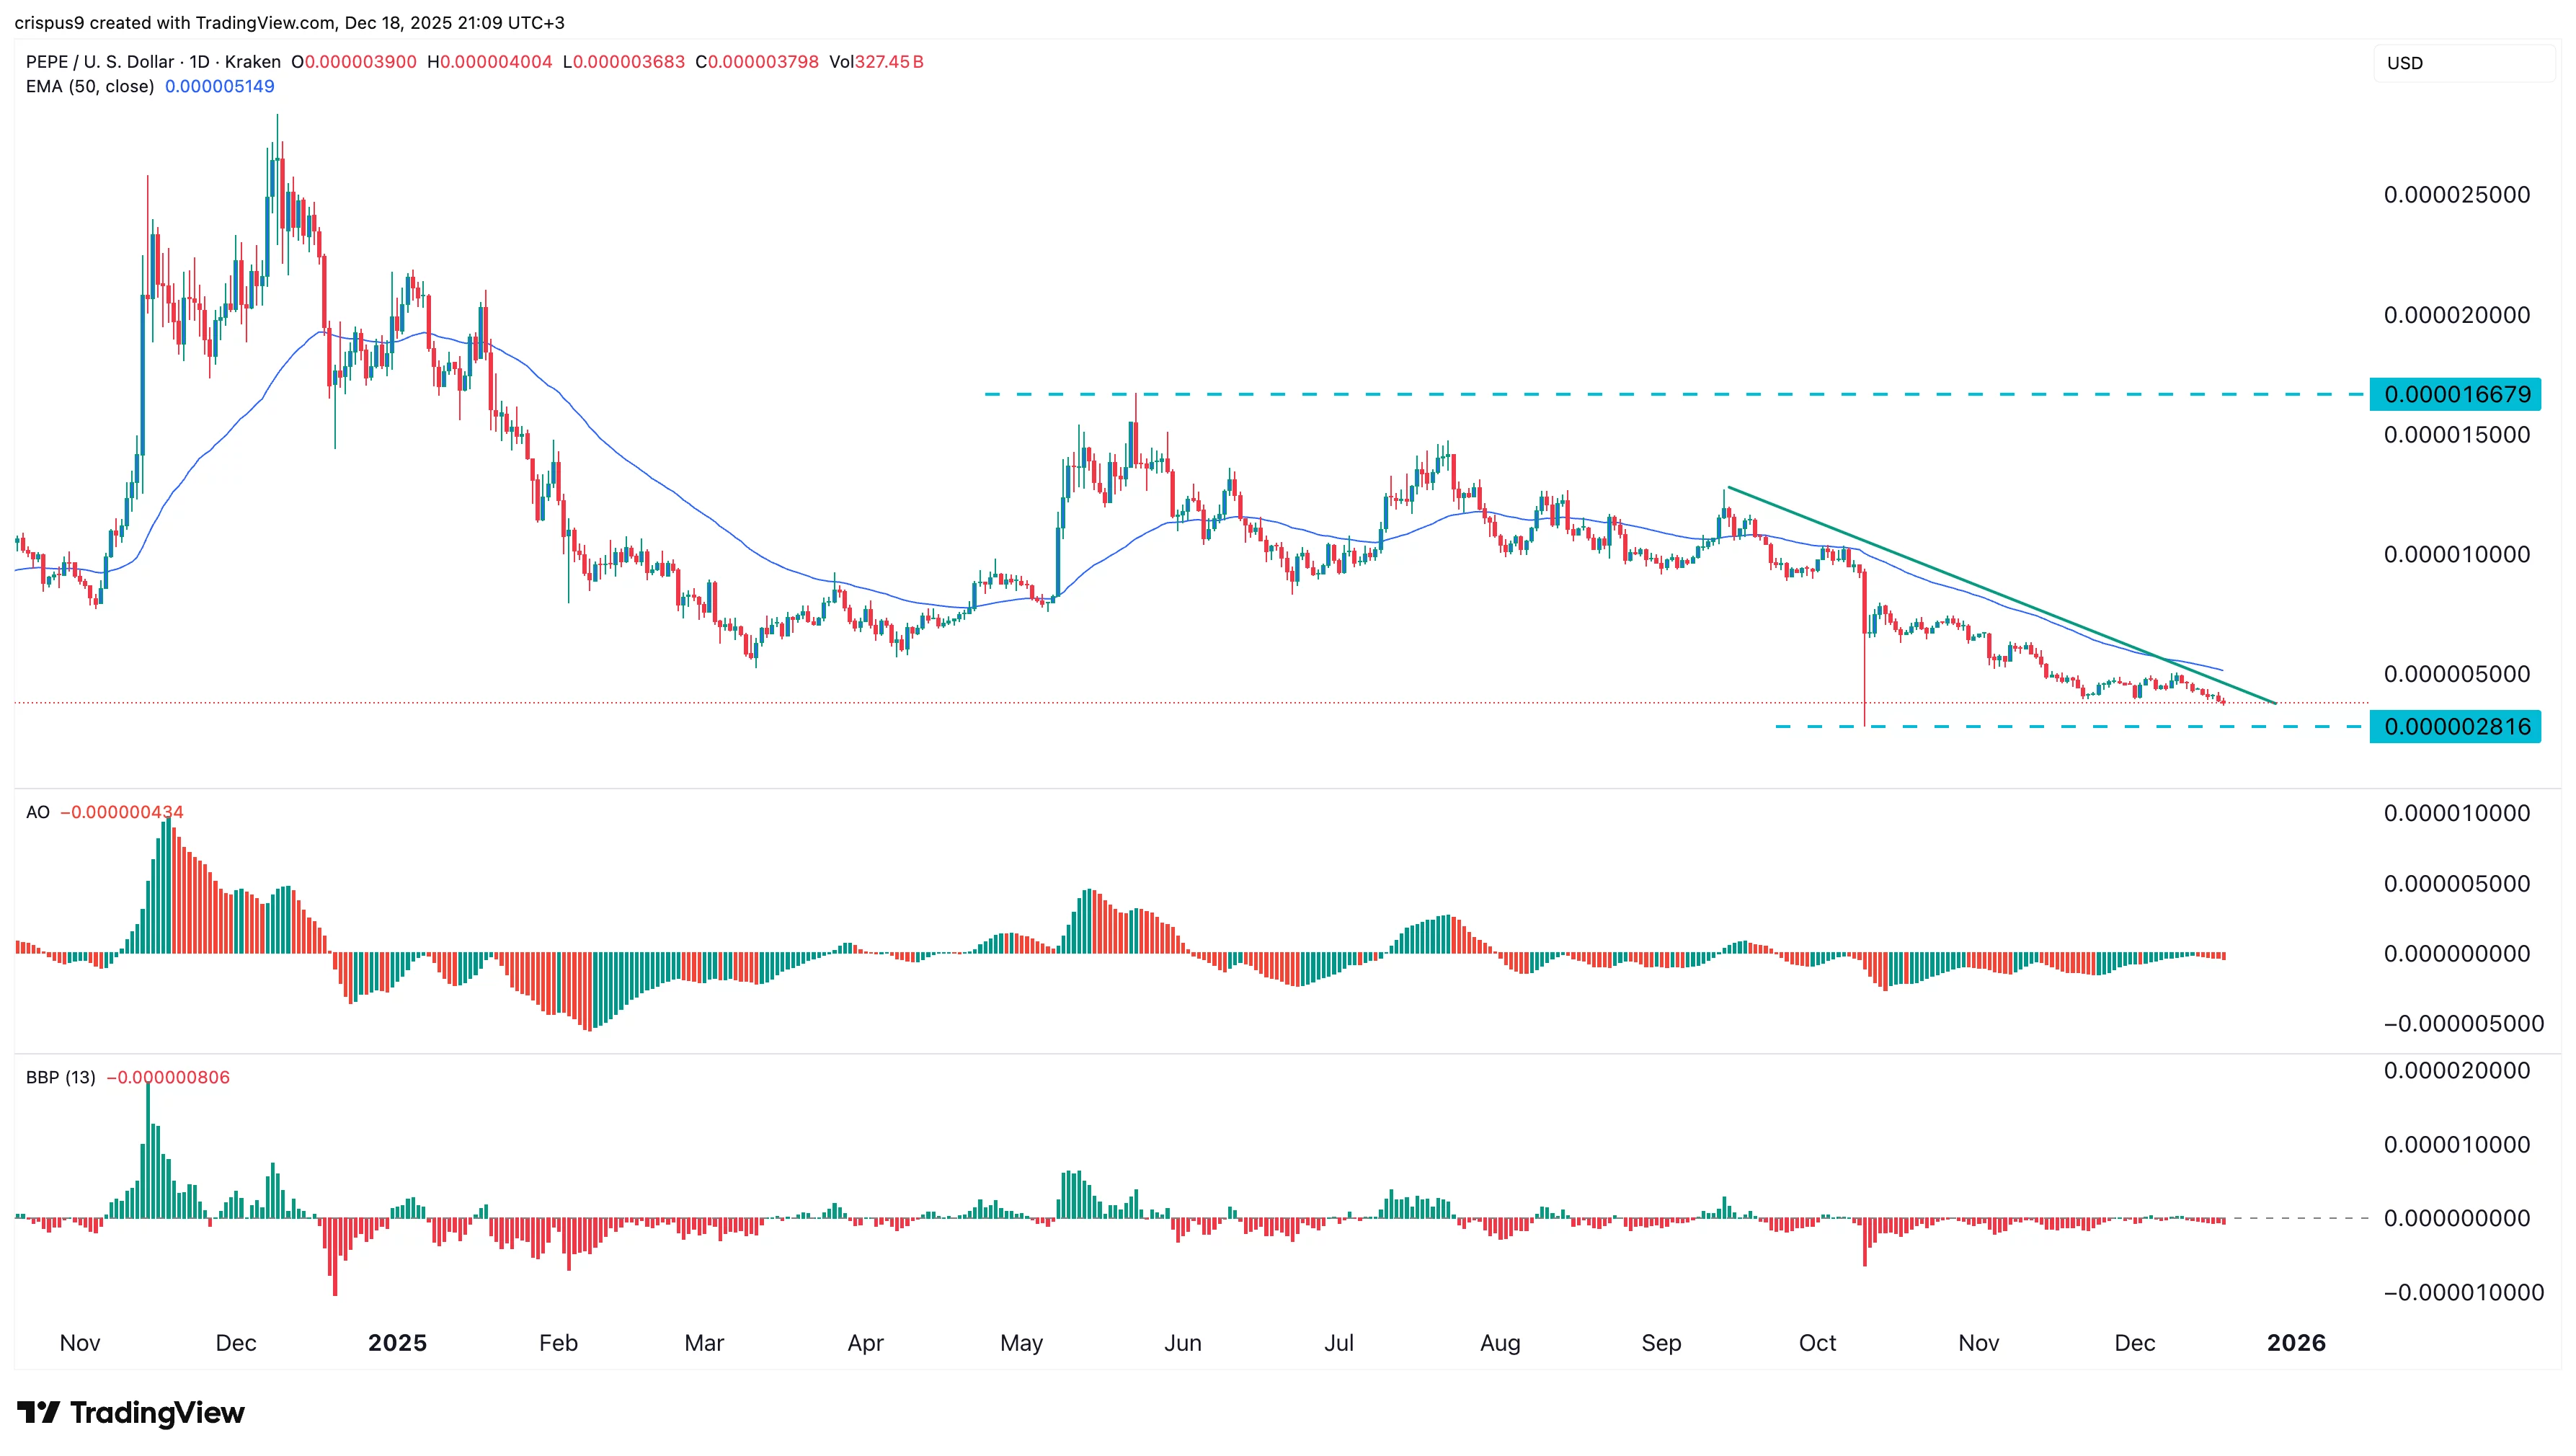
The daily timeframe chart indicates that the Pepe Coin price has been in a pronounced downward trend since peaking at $0.00001667 in May this year. It has remained below all moving averages and the Parabolic SAR indicator. 

The Awesome Oscillator and the Bull/Bear Power indicators have moved below the zero line, a sign that bears have prevailed. It remains below all moving averages and the descending trendline. 

Therefore, the most likely Pepe price forecast is bearish, with the initial target being at $0.000002816, its lowest point in October. This price is about 30% below the current level. 

The bearish outlook will be invalidated if the coin moves above the 50-day moving average’s dynamic resistance.

Market Opportunity
Pepe Logo
Pepe Price(PEPE)
$0.000003891
$0.000003891$0.000003891
-2.13%
USD
Pepe (PEPE) Live Price Chart
Disclaimer: The articles reposted on this site are sourced from public platforms and are provided for informational purposes only. They do not necessarily reflect the views of MEXC. All rights remain with the original authors. If you believe any content infringes on third-party rights, please contact [email protected] for removal. MEXC makes no guarantees regarding the accuracy, completeness, or timeliness of the content and is not responsible for any actions taken based on the information provided. The content does not constitute financial, legal, or other professional advice, nor should it be considered a recommendation or endorsement by MEXC.

You May Also Like

REX Shares’ Solana staking ETF sees $10M inflows, AUM tops $289M for first time

REX Shares’ Solana staking ETF sees $10M inflows, AUM tops $289M for first time

The post REX Shares’ Solana staking ETF sees $10M inflows, AUM tops $289M for first time appeared on BitcoinEthereumNews.com. Key Takeaways REX Shares’ Solana staking ETF saw $10 million in inflows in one day. Total inflows over the past three days amount to $23 million. REX Shares’ Solana staking ETF recorded $10 million in inflows yesterday, bringing total additions to $23 million over the past three days. The fund’s assets under management climbed above $289.0 million for the first time. The SSK ETF is the first U.S. exchange-traded fund focused on Solana staking. Source: https://cryptobriefing.com/rex-shares-solana-staking-etf-aum-289m/
Share
BitcoinEthereumNews2025/09/18 02:34
Microsoft Corp. $MSFT blue box area offers a buying opportunity

Microsoft Corp. $MSFT blue box area offers a buying opportunity

The post Microsoft Corp. $MSFT blue box area offers a buying opportunity appeared on BitcoinEthereumNews.com. In today’s article, we’ll examine the recent performance of Microsoft Corp. ($MSFT) through the lens of Elliott Wave Theory. We’ll review how the rally from the April 07, 2025 low unfolded as a 5-wave impulse followed by a 3-swing correction (ABC) and discuss our forecast for the next move. Let’s dive into the structure and expectations for this stock. Five wave impulse structure + ABC + WXY correction $MSFT 8H Elliott Wave chart 9.04.2025 In the 8-hour Elliott Wave count from Sep 04, 2025, we saw that $MSFT completed a 5-wave impulsive cycle at red III. As expected, this initial wave prompted a pullback. We anticipated this pullback to unfold in 3 swings and find buyers in the equal legs area between $497.02 and $471.06 This setup aligns with a typical Elliott Wave correction pattern (ABC), in which the market pauses briefly before resuming its primary trend. $MSFT 8H Elliott Wave chart 7.14.2025 The update, 10 days later, shows the stock finding support from the equal legs area as predicted allowing traders to get risk free. The stock is expected to bounce towards 525 – 532 before deciding if the bounce is a connector or the next leg higher. A break into new ATHs will confirm the latter and can see it trade higher towards 570 – 593 area. Until then, traders should get risk free and protect their capital in case of a WXY double correction. Conclusion In conclusion, our Elliott Wave analysis of Microsoft Corp. ($MSFT) suggested that it remains supported against April 07, 2025 lows and bounce from the blue box area. In the meantime, keep an eye out for any corrective pullbacks that may offer entry opportunities. By applying Elliott Wave Theory, traders can better anticipate the structure of upcoming moves and enhance risk management in volatile markets. Source: https://www.fxstreet.com/news/microsoft-corp-msft-blue-box-area-offers-a-buying-opportunity-202509171323
Share
BitcoinEthereumNews2025/09/18 03:50
The Digital WOW Explains How AI Is Affecting Digital Marketing

The Digital WOW Explains How AI Is Affecting Digital Marketing

WEST PALM BEACH, Fla., Dec. 19, 2025 /PRNewswire/ — The Digital WOW, powered by ConsultPR.net, announces new findings on how AI is affecting digital marketing.
Share
AI Journal2025/12/19 17:30