

Ethereum price flashes an alarming pattern as ETF outflows rise

Ethereum price has gone nowhere since February 7 this year. While this could be a sign of bottoming, it has formed an alarming chart pattern, signaling a potential crash.
- Ethereum price has formed a bearish flag pattern on the daily chart.
- Spot ETH ETFs have shed millions of assets this month.
- The coin may have a strong bearish breakout in the near term.
Ethereum (ETH) price was trading at $2,065 today, March 10, as it rose for the second consecutive day. Despite this rise, it has remained inside the support and resistance levels at $1,843 and $2,143.
The ongoing consolidation has coincided with the waning demand for its exchange-traded funds. SoSoValue data shows that these funds have shed assets in the last three consecutive days. They shed $51 million in assets on Monday after losing $83 million and $90 million in the previous two trading days.
Ethereum ETFs have lost over $37 million in assets this month, and is in the fifth consecutive month in the red. As a result, the cumulative net inflow has dropped from nearly $15 billion to $11.58 billion.
Ethereum has diverged from Bitcoin, whose ETFs have added over $735 milion in inflows this month. Solana ETFs have added $21 million in assets, while Chainlink funds have gained $4.8 billion.
On the positive side, Ethereum’s fundamentals are still strong. For example, data shows that its stablecoin supply has jumped to over $166 billion, while its transaction volume in the last 30 days jumped to over $1.1 trillion. It is also the market leader in the real-world asset tokenization industry by far.
Ethereum price technical analysis
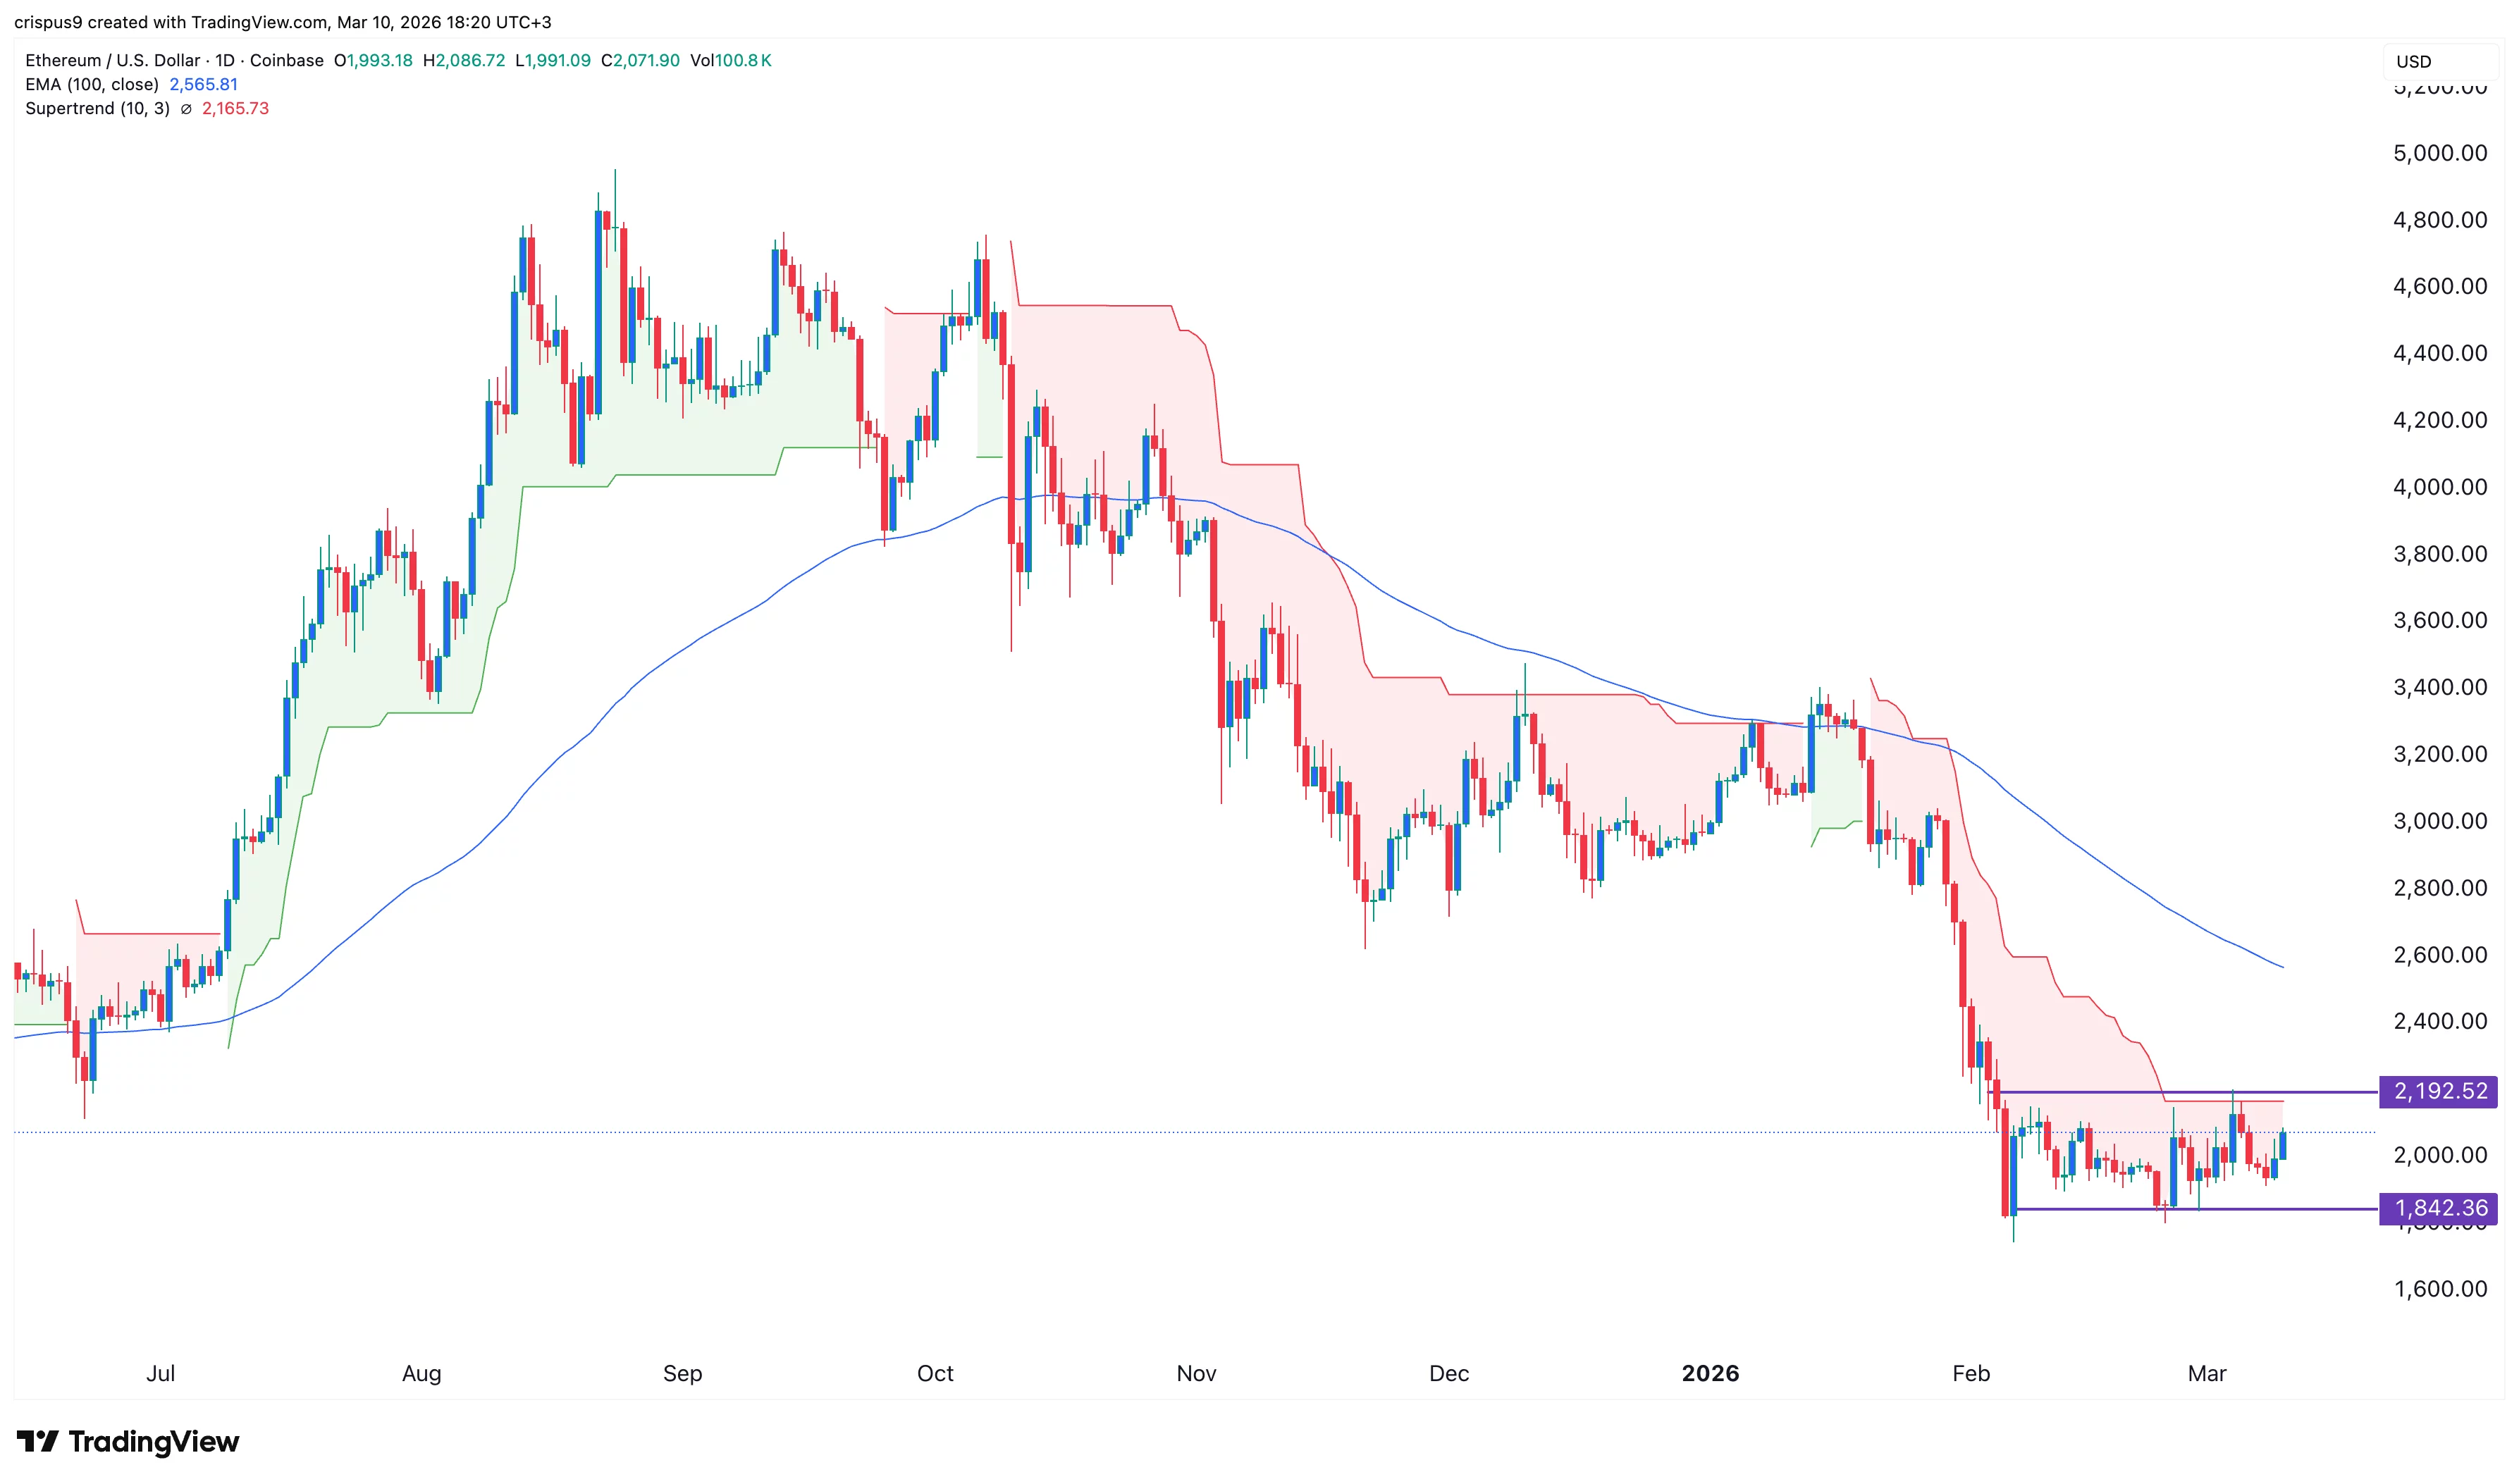
ETH price could be at risk of a big drop in the near term. The daily chart shows that it has formed a horizontal channel in the last 30 days. This channel formed after it dropped sharply. As a result, it has formed a bearish flag pattern, a popular continuation pattern.
The coin has remains below all moving averages and the Supertrend indicator. Therefore, the most likely outcome is where it resumes the downtrend, potentially to the lower side of the flag at $1,843. A drop below that level will point to more downside, potentially to the psychological level at $1,500.
You May Also Like

VAT reductions seen viable with exemption crackdown

U.S. SEC chief Atkins said bond with sister agency CFTC to include joint meetings, exams
Copy linkX (Twitter)LinkedInFacebookEmail
