

Bitcoin Realized Loss Spike Proves False as Market Activity Remains Thin
Bitcoin is trading around $90,000 at the time of writing, following a period of elevated realized losses that initially appeared to signal renewed short-term holder (STH) capitulation.
However, on-chain data shows that the recent spike in realized losses was not driven by distribution, but by internal UTXO consolidation, distorting several commonly used STH indicators.
According to CryptoQuant, the market reaction around January 23 reflects a technical artifact rather than a genuine shift in investor behavior. Once this anomaly is isolated, overall on-chain activity appears muted, suggesting the market remains in a consolidation phase rather than entering a new sell-driven regime.
This distinction is critical, as misreading these signals could lead to incorrect conclusions about trend strength and investor conviction.
Short-Term Price Context and Realized Loss Activity
Bitcoin price remained relatively stable through late January, holding above the $85,000–$87,000 zone while realized losses briefly surged. The realized profit and loss chart shows a sharp negative spike approaching -$6 billion, visually similar to prior stress events such as the late-November Coinbase-related movement.
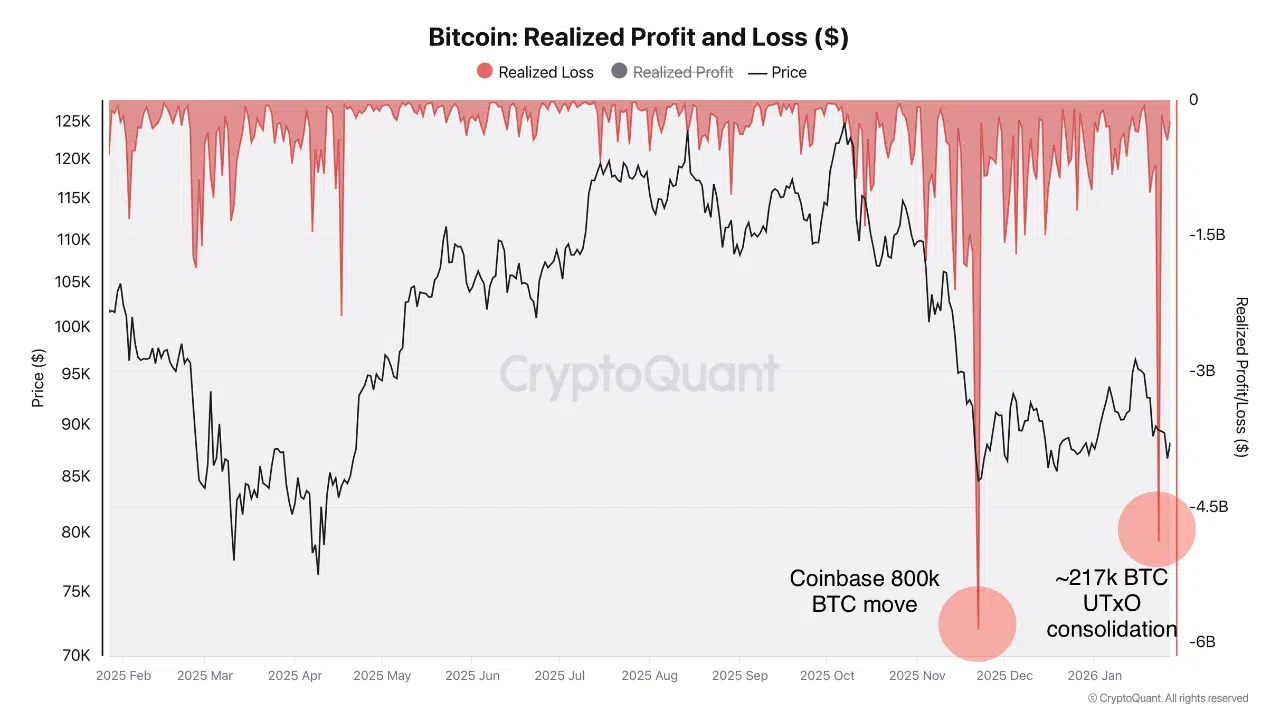 At first glance, this suggested aggressive STH selling. Historically, such spikes often coincide with emotional exits and trend exhaustion. However, price did not follow through to the downside, nor did volatility expand meaningfully, creating an early inconsistency between price behavior and on-chain stress signals.
This divergence prompted a deeper inspection of the underlying UTXO activity.
UTXO Consolidation Triggered a False STH Signal
On January 23, a single block (933,503) included multiple UTXO consolidation transactions that collectively moved approximately 217,000 BTC.
Importantly, these coins were not sold. They were transferred from an address back to the same address, purely to aggregate fragmented UTXOs.
The breakdown of the moved supply shows:
- ~188,000 BTC from the 3m–6m age band
- ~30,900 BTC from the 1m–3m band
- ~31,700 BTC from the 1w–1m band
All BTC in the 3m–6m cohort were likely acquired during the October 10 drawdown, at prices between $102,000 and $126,000. When these UTXOs were destroyed and recreated through consolidation, they were recorded as realized losses because Bitcoin was trading significantly lower on January 23.
This mechanically inflated realized loss metrics without reflecting actual selling pressure.
Why Multiple Indicators Were Distorted
Because realized price is embedded across several on-chain metrics, this consolidation event impacted:
- STH MVRV
- STH SOPR
- Short-term cost basis
- Aggregate realized loss readings
The effect mirrors a similar false signal observed during the Coinbase-related movement in late November, where internal wallet restructuring briefly produced outsized realized losses without corresponding market exits.
Once these extraordinary events are excluded, the data shows very little genuine on-chain activity, reinforcing the view that neither panic nor aggressive distribution is currently underway.
Market Interpretation and Risk Context
This episode highlights an important limitation of surface-level on-chain analysis. Not all realized losses represent selling, and not all STH signals reflect behavioral stress. In this case, the market absorbed a large technical adjustment without price breakdown, suggesting resilience rather than weakness.
With Bitcoin holding above $85,000 and realized loss pressure largely attributable to accounting mechanics, the broader structure remains one of low participation and consolidation, not capitulation.
Until genuine spending activity increases across multiple age bands, realized loss spikes should be treated cautiously, especially when price action fails to confirm the signal.
Conclusion
The January 23 realized loss spike was not a sell-off, but a UTXO consolidation event that temporarily distorted short-term holder metrics. Once adjusted for this anomaly, on-chain data points to a market with minimal activity and reduced directional conviction.
For now, Bitcoin remains in a holding pattern. Confirmation will require either sustained distribution accompanied by price acceptance below support, or renewed demand that expands both volume and realized profits. Until then, the market appears structurally quiet rather than stressed.
The post Bitcoin Realized Loss Spike Proves False as Market Activity Remains Thin appeared first on ETHNews.
You May Also Like

Stripe and Paradigm’s Tempo mainnet goes live for machine payments

Fed Acts on Economic Signals with Rate Cut


