

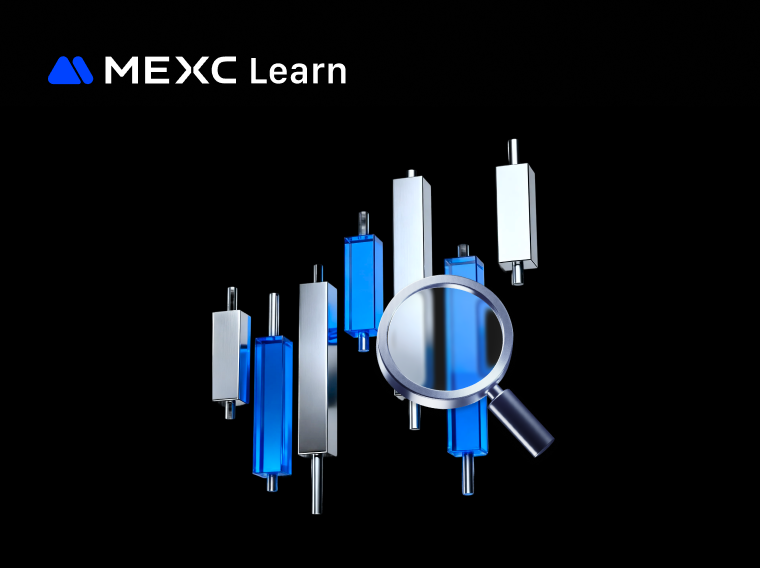
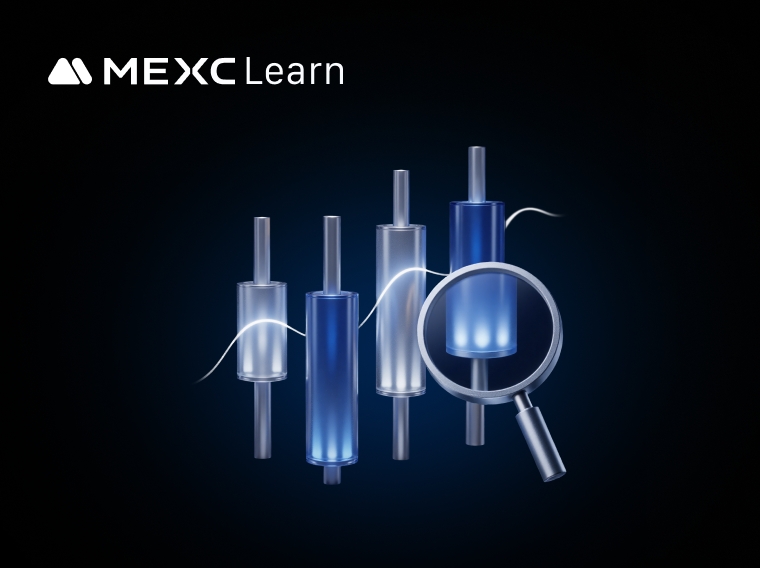
Analysis of Common Technical Indicators in the Cryptocurrency Market
1. Overview of Common Technical Indicators
1)Moving Average (MA)
2)Exponential Moving Average (EMA)
3)Moving Average Convergence Divergence (MACD)
4) Bollinger Bands (BOLL)
5)Relative Strength Index (RSI)
2. Advantages and Disadvantages of Common Technical Indicators
Technical Indicator | Advantages | Disadvantages |
Moving Average (MA) | Filters out short-term price fluctuations; provides support/resistance levels and trend reversal signals. | Lags behind price; ineffective in sideways markets and may be misled by outliers. |
Exponential Moving Average (EMA) | Responds more quickly to price changes; offers better smoothing and adaptability. | Can be overly sensitive, leading to false signals; may generate unreliable early reversal signals. |
MACD (Moving Average Convergence Divergence) | Strong trend-following capability; divergence between price and MACD helps identify reversals. | Suffers from lag; prone to false signals during sideways/consolidating markets. |
Bollinger Bands (BOLL) | Effectively reflects market volatility and provides support/resistance levels; mid-band helps with trend assessment. | Lagging indicator; can be misleading during false breakouts. |
Relative Strength Index (RSI) | Clearly signals overbought or oversold conditions and gauges trend strength. | Prone to noise in ranging markets; highly sensitive to the selected time period and may require adjustments. |
3. Benefits of Learning Technical Indicators
3.1 Accurately Identifying Market Trends
3.2 Effectively Managing Trading Risk
3.3 Enhancing the Scientific Basis of Trading Decisions
4. How to Set Up Technical Indicators on MEXC
5. Conclusion
Recommended Reading:
- Why Choose MEXC Futures? Gain deeper insight into the advantages and unique features of MEXC Futures to help you stay ahead in the market.
- MEXC Futures Trading Tutorial (Website) Learn the full process of trading Futures on the web platform in detail, making it easy to get started and navigate Futures trading with confidence.
Popular Articles

How to Trade EDGE Token on MEXC Pre-Market Perpetual Futures: A Comprehensive Guide to Seizing DeFi Trading Opportunities
Key Takeaways EDGE Token Overview: EDGE is the native token of EdgeX decentralized derivatives exchange, playing a core role in platform governance, fee discounts, and staking rewardsPre-Market Tradin

How to Claim EDGE Token Airdrop: Complete Guide to EdgeX Decentralized Exchange Platform Token Airdrop
Key Takeaways EDGE Airdrop Eligibility: EdgeX rewards early supporters and active users through multiple campaigns, including Genesis allocation, pre-TGE seasons, and community contributorsClaim Timel
What is EDGE? A Comprehensive Guide to EdgeX Exchange's Native Token
Key Takeaways EDGE is the native utility token of EdgeX, a decentralized derivatives exchange (DEX) built on the Base blockchainEdgeX combines the transparency and security of decentralized finance wi
Why is Gold Going Down: The Core Drivers and Trading Strategies Behind the March 2026 Macro Sell-Off
Today, the entire precious metals market is asking the same question: why is gold going down? As prices struggle heavily around the critical 4850 support level, many retail traders accustomed to the n
Hot Crypto Updates
View More
How to Convert 114514 (114514) Crypto to Cash? A Beginner's Complete Guide
Converting cryptocurrency to cash might seem complicated, but it's actually straightforward once you understand the process. Whether you're holding 114514 (114514) or any other digital asset, there

How to Convert 人生K线 (人生K线) Crypto to Cash? A Beginner's Complete Guide
Converting cryptocurrency to cash might seem complicated, but it's actually straightforward once you understand the process. Whether you're holding 人生K线 (人生K线) or any other digital asset, there are

How to Convert James Wynn Real (WYNN) Crypto to Cash? A Beginner's Complete Guide
Converting cryptocurrency to cash might seem complicated, but it's actually straightforward once you understand the process. Whether you're holding James Wynn Real (WYNN) or any other digital asset,

How to Convert Snowball (SNOWBALL) Crypto to Cash? A Beginner's Complete Guide
Converting cryptocurrency to cash might seem complicated, but it's actually straightforward once you understand the process. Whether you're holding Snowball (SNOWBALL) or any other digital asset,
Trending News
View More
The Automated Helpdesk: Why Level 1 Support is Now Handled by AI, and What That Means for Your Staff
The Rising Role of AI in Level 1 Support In recent years, artificial intelligence (AI) has dramatically transformed numerous facets of business operations, and

The Korean National Tax Service plans to select a professional escrow company in the first half of the year to manage the seized virtual assets.
PANews reported on March 20th that, according to ZDNET, the South Korean National Tax Service plans to select a private escrow company within the first half of

My GreekCharter Is at The Forefront of a Market For Rare, All-Inclusive Yacht Charters In Greece
MyGreekCharter, operated by DMA Yachting, is helping open a new market for all-inclusive yacht charters in Greece for 2026. While all-inclusive pricing has long

Binance will launch PAYPUSDT U-margined perpetual contracts.
PANews reported on March 20 that Binance Futures will launch a PAYPUSDT equity perpetual contract on March 23, 2026 at 22:30 (UTC+8), with the underlying asset
Related Articles

What is Parabolic SAR?
The Parabolic SAR (Stop and Reverse) is a widely used technical analysis tool designed to determine the direction of price trends and identify potential reversal points. This indicator plots a series

How to Use TradingView on MEXC
TradingView is a powerful trading analysis tool that caters to users of all experience levels. MEXC has integrated TradingView's charting tools, allowing you to use them directly on the MEXC platform.
How to View MEXC Futures Account Assets and Open Positions For Improved Trading
Cryptocurrency futures trading has become popular among investors due to its flexibility and wide range of trading pairs. MEXC Futures, in particular, is well recognized by users for offering over 1,3
Common Technical Analysis Theories
Technical analysis is a widely used tool in financial investing, aimed at predicting future market trends by studying historical price movements and trading data. This article will break down the core
