Internet Computer (ICP) and NEAR Protocol lead the top 10 AI and Big Data cryptos with the highest development activities.  Despite their dominance in this sector, they appear to be struggling in the market as ICP records decline across all the major trading sessions.  Recently, the Santiment team launched an  Ecosystem Dev Activity Dashboard that [...]]]>Internet Computer (ICP) and NEAR Protocol lead the top 10 AI and Big Data cryptos with the highest development activities.  Despite their dominance in this sector, they appear to be struggling in the market as ICP records decline across all the major trading sessions.  Recently, the Santiment team launched an  Ecosystem Dev Activity Dashboard that [...]]]>

Top 10 AI & Big Data Crypto Projects Revealed — ICP, NEAR, and INJ Lead Developer Rankings

3 min read
  • Internet Computer (ICP) and NEAR Protocol lead the top 10 AI and Big Data cryptos with the highest development activities. 
  • Despite their dominance in this sector, they appear to be struggling in the market as ICP records decline across all the major trading sessions. 

Recently, the Santiment team launched an  Ecosystem Dev Activity Dashboard that displays the software development events created by various blockchains and their related Decentralized Applications (DApps). According to a report, the initiative has been designed to filter out low-value actions, focusing on real programming progress

ICP, NEAR, Injective, and Others Dominate in Dev Activities

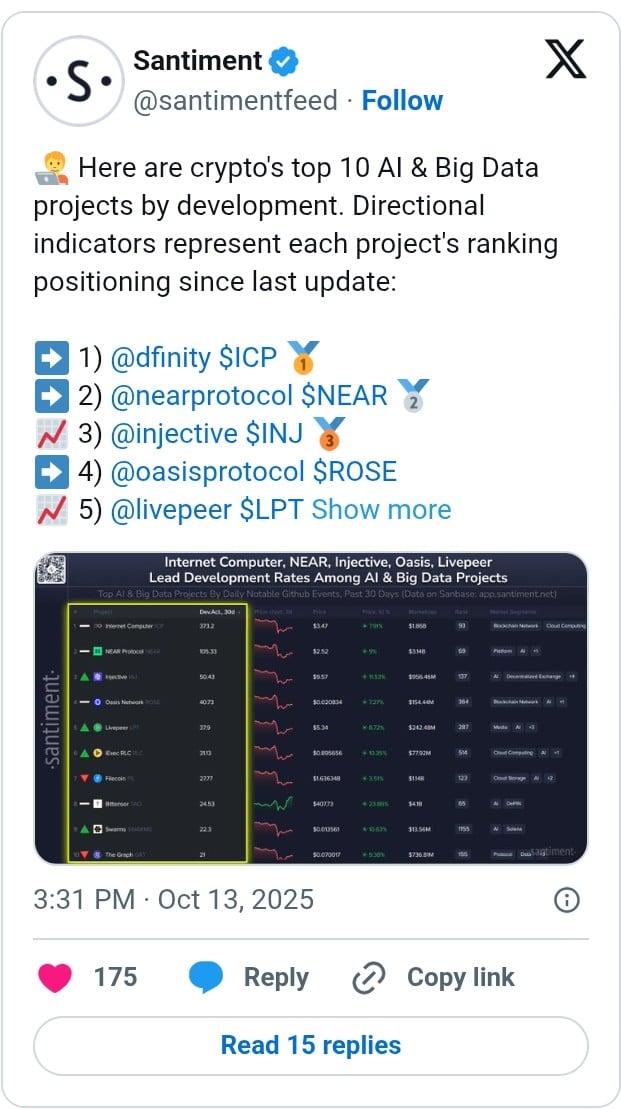
With reference to the display on the dashboard, Santiment has compiled a list of 10 Artificial Intelligence (AI) and Big Data crypto projects that are dominating based on their development events. Per the data, the first on the list is DFINITY Foundation’s Internet Computer (ICP). In the last 30 days, it has amassed a score of 373.

As noted in our earlier coverage, ICP was also leading the list of top blockchain platforms with the highest development activities last month, with a score of 423.1.

Behind ICP in the AI and Big Data sector is NEAR Protocol which has a development activity score of 105. This is also followed by Injective (50), OASIS Network (40), and Livepeer (39) completing the top five. According to Santiment, iExec RLC (31), Filecoin (27), Bittensor (24), Swarms (22), and The Graph (21) occupied the sixth to 10th position respectively.

ICP

In an accompanying Medium post, the importance of development activities was highlighted, as their numbers indicate the likelihood a project has to grow its products and be adopted by users.

In the post, Development Activities was said to be understood by many as the representation of the number of commits that a project has in its GitHub repositories. However, this could show flaws, hence the reason to introduce the new approach. This filtering approach is reported to differentiate two types of activities, namely Development Activity and GitHub Activity.

One interesting observation we came across is that most of the AI and BIG Data crypto projects dominating in the development activities are currently struggling in the market. ICP, for instance, has recorded losses across all the major trading sessions, declining by 3.2% in the last 24 hours, 24% in the last seven days, 30% in the last 30 days, and 37% in the last 90 days. Currently, the asset is trading at $3.4. As highlighted in our last analysis, ICP could bounce back to $7 when the broad market rally resumes.

NEAR, which is the second on the list of projects with the highest development activities, has also recorded losses across all the major trading sessions, declining by 19% in the last seven days.

NEAR is expected to stage a rebound as it announces several high-profile initiatives that could soon reflect in its price. As mentioned in our earlier news brief, it has introduced AI roles in blockchain governance to simplify its operations.

This does not end there. NEAR is also supporting Web3 AI with a new $20 million development fund, as explained in our previous publication.

]]>
Market Opportunity
TOP Network Logo
TOP Network Price(TOP)
$0.000096
$0.000096$0.000096
0.00%
USD
TOP Network (TOP) Live Price Chart
Disclaimer: The articles reposted on this site are sourced from public platforms and are provided for informational purposes only. They do not necessarily reflect the views of MEXC. All rights remain with the original authors. If you believe any content infringes on third-party rights, please contact [email protected] for removal. MEXC makes no guarantees regarding the accuracy, completeness, or timeliness of the content and is not responsible for any actions taken based on the information provided. The content does not constitute financial, legal, or other professional advice, nor should it be considered a recommendation or endorsement by MEXC.
Tags:

You May Also Like

Securities Fraud Investigation Into Corcept Therapeutics Incorporated (CORT) Announced – Shareholders Who Lost Money Urged To Contact Glancy Prongay Wolke & Rotter LLP, a Leading Securities Fraud Law Firm

Securities Fraud Investigation Into Corcept Therapeutics Incorporated (CORT) Announced – Shareholders Who Lost Money Urged To Contact Glancy Prongay Wolke & Rotter LLP, a Leading Securities Fraud Law Firm

LOS ANGELES–(BUSINESS WIRE)–Glancy Prongay Wolke & Rotter LLP, a leading national shareholder rights law firm, today announced that it has commenced an investigation
Share
AI Journal2026/02/05 04:00
Microsoft Corp. $MSFT blue box area offers a buying opportunity

Microsoft Corp. $MSFT blue box area offers a buying opportunity

The post Microsoft Corp. $MSFT blue box area offers a buying opportunity appeared on BitcoinEthereumNews.com. In today’s article, we’ll examine the recent performance of Microsoft Corp. ($MSFT) through the lens of Elliott Wave Theory. We’ll review how the rally from the April 07, 2025 low unfolded as a 5-wave impulse followed by a 3-swing correction (ABC) and discuss our forecast for the next move. Let’s dive into the structure and expectations for this stock. Five wave impulse structure + ABC + WXY correction $MSFT 8H Elliott Wave chart 9.04.2025 In the 8-hour Elliott Wave count from Sep 04, 2025, we saw that $MSFT completed a 5-wave impulsive cycle at red III. As expected, this initial wave prompted a pullback. We anticipated this pullback to unfold in 3 swings and find buyers in the equal legs area between $497.02 and $471.06 This setup aligns with a typical Elliott Wave correction pattern (ABC), in which the market pauses briefly before resuming its primary trend. $MSFT 8H Elliott Wave chart 7.14.2025 The update, 10 days later, shows the stock finding support from the equal legs area as predicted allowing traders to get risk free. The stock is expected to bounce towards 525 – 532 before deciding if the bounce is a connector or the next leg higher. A break into new ATHs will confirm the latter and can see it trade higher towards 570 – 593 area. Until then, traders should get risk free and protect their capital in case of a WXY double correction. Conclusion In conclusion, our Elliott Wave analysis of Microsoft Corp. ($MSFT) suggested that it remains supported against April 07, 2025 lows and bounce from the blue box area. In the meantime, keep an eye out for any corrective pullbacks that may offer entry opportunities. By applying Elliott Wave Theory, traders can better anticipate the structure of upcoming moves and enhance risk management in volatile markets. Source: https://www.fxstreet.com/news/microsoft-corp-msft-blue-box-area-offers-a-buying-opportunity-202509171323
Share
BitcoinEthereumNews2025/09/18 03:50
Over 80% of 135 Ethereum L2s record below 1 user operation per second

Over 80% of 135 Ethereum L2s record below 1 user operation per second

The post Over 80% of 135 Ethereum L2s record below 1 user operation per second  appeared on BitcoinEthereumNews.com. Ethereum’s L2s are not doing too well. Data
Share
BitcoinEthereumNews2026/02/05 03:52