

Top 3 Price Prediction: Bitcoin, Ethereum, Ripple – Bears set sight on $98K BTC, $2K ETH and $1.77 XRP
- Bitcoin price is nearing its key support level at $100,000; a close below this level will likely trigger a further correction.
- Ethereum experiences a nearly 13% weekly decline, slipping below its critical $2,461 support level.
- XRP nears its daily support at $1.96, a close below this level could push it toward $1.77.
Bitcoin (BTC), Ethereum (ETH), and Ripple (XRP) declined by nearly 5%, 13%, and 7%, respectively, last week as tensions in the Middle East escalated. BTC is nearly at its key support level of around $100,000; a close below this level would trigger further correction. Meanwhile, ETH and XRP slipped below key support levels, suggesting that weakness and correction may carry ETH toward $2,000 and XRP toward $1.77.
Bitcoin could face a deeper correction if it closes below the $100,000 support level
Bitcoin price closed below its 50-day Exponential Moving Average at $102,942 on Saturday and declined 1.13%, reaching a low of $98,200 the following day. At the time of writing on Monday, it hovers around its key level of $100,000.
If BTC continues its correction and closes below $100,000 on a daily basis, it could extend the decline to retest its Sunday low of $98,200.
The Relative Strength Index (RSI) on the daily chart reads 38, which is below its neutral level, indicating strong bearish momentum. Moreover, the Moving Average Convergence Divergence (MACD) on the daily chart showed a bearish crossover. It also shows a rising red histogram bar below its neutral level, suggesting bearish strength and indicating the continuation of a downward trend.
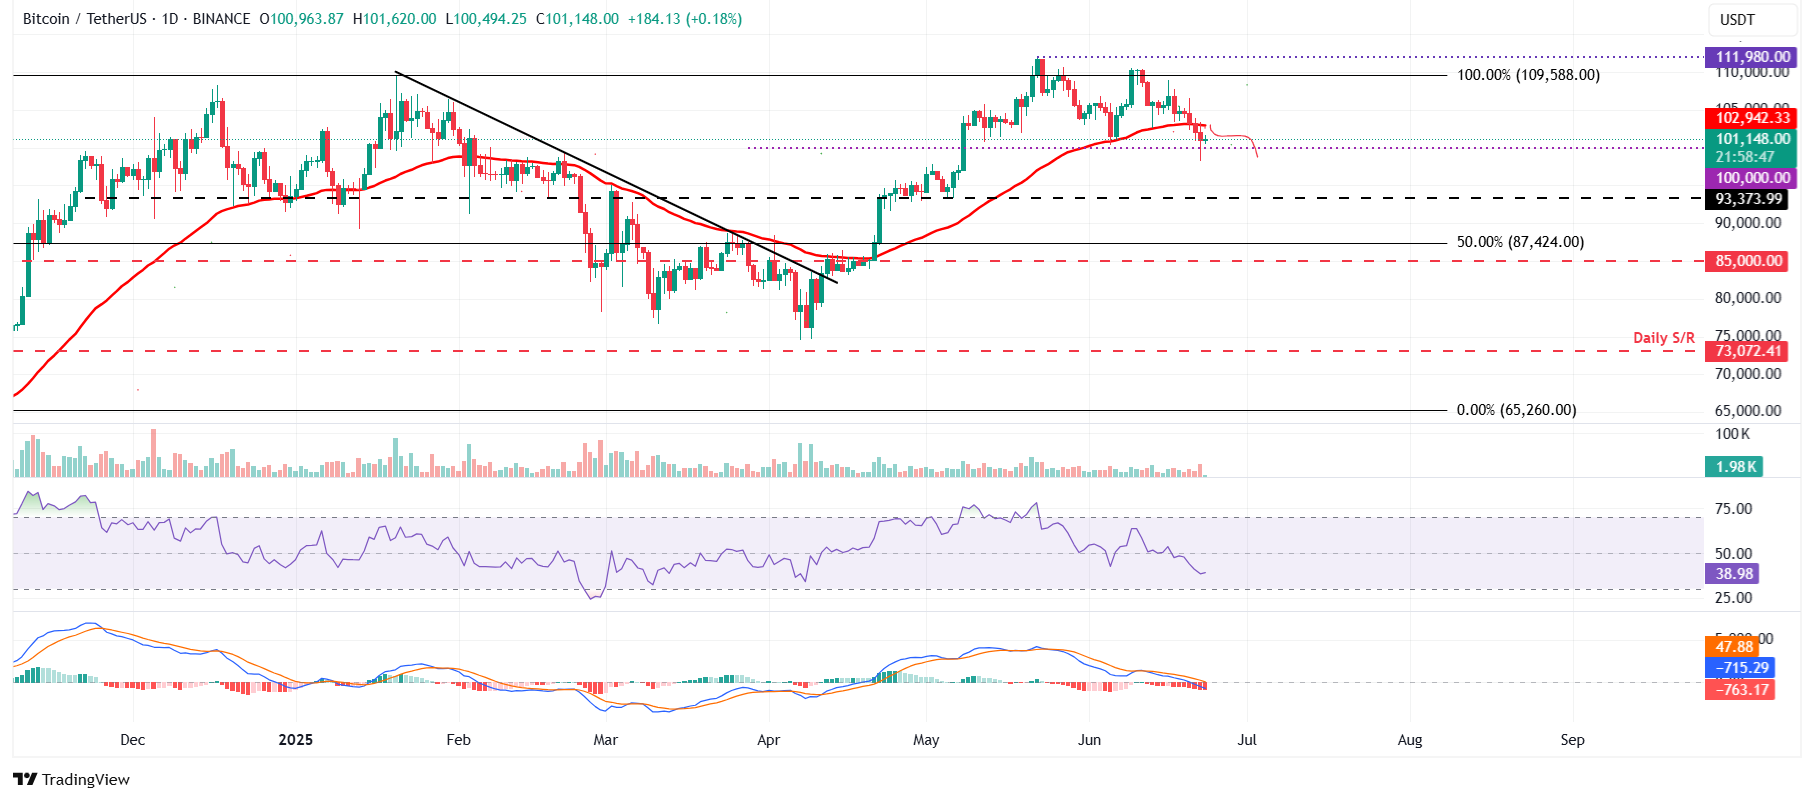
BTC/USDT daily chart
However, if BTC recovers, it could extend the recovery toward its 50-day EMA at $102,942.
Ethereum is set for a downleg as it closes below its 50-day EMA
Ethereum price broke below the lower consolidation level of $2,461 and closed below the 50-day EMA at $2,416 on Friday, falling 7.65% over the next two days. At the time of writing on Monday, it trades at around $2,241.
If ETH continues its correction, it could extend the decline to retest its next support level at $2,000.
The RSI on the daily chart reads 34, nearing its oversold conditions, indicating a strong bearish momentum. The MACD indicators also showed a bearish crossover. It also shows a rising red histogram bar below its neutral level, suggesting bearish strength and indicating the continuation of a downward trend.
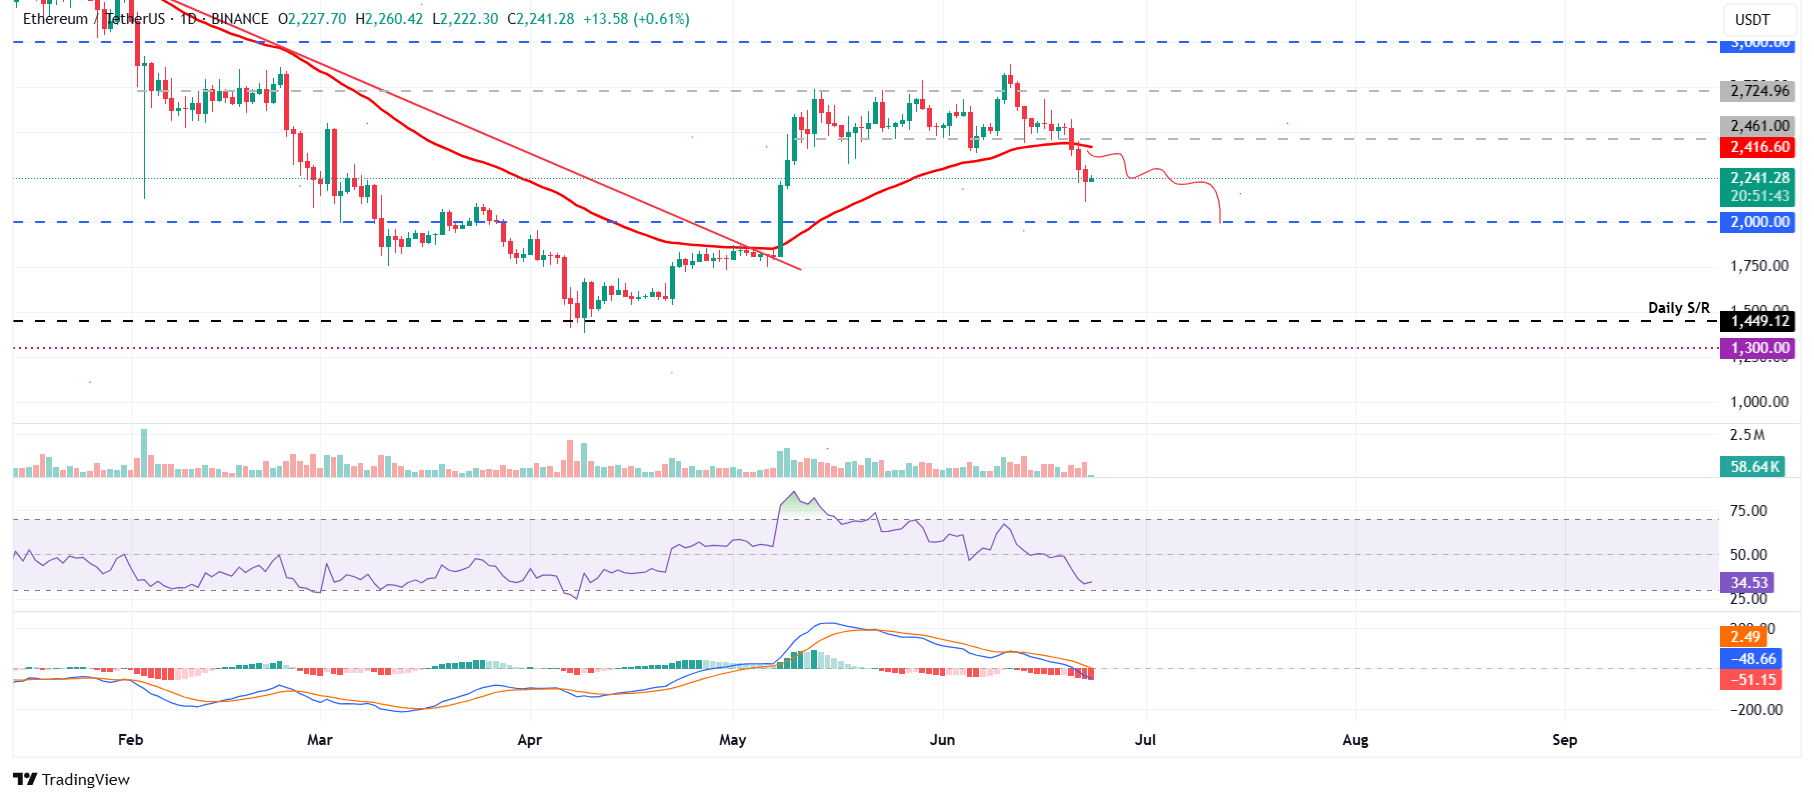
ETH/USDT daily chart
On the other hand, if ETH recovers, it could extend the recovery toward its 50-day EMA at $2,416.
XRP could extend the correction if it closes below the $1.96 daily support level
XRP faced rejection from its 50-day EMA at $2.21 on June 17 and declined 10% until Sunday. At the time of writing on Monday, it is nearing its daily support at $1.96.
If XRP breaks and closes below the daily support at $1.96 on a daily basis, it could extend the decline toward its next support at $1.77.
The RSI on the daily chart reads 36, nearing its oversold conditions, indicating a strong bearish momentum. The MACD indicators also showed a bearish crossover. It also shows a rising red histogram bar below its neutral level, suggesting bearish strength and indicating the continuation of a downward trend.
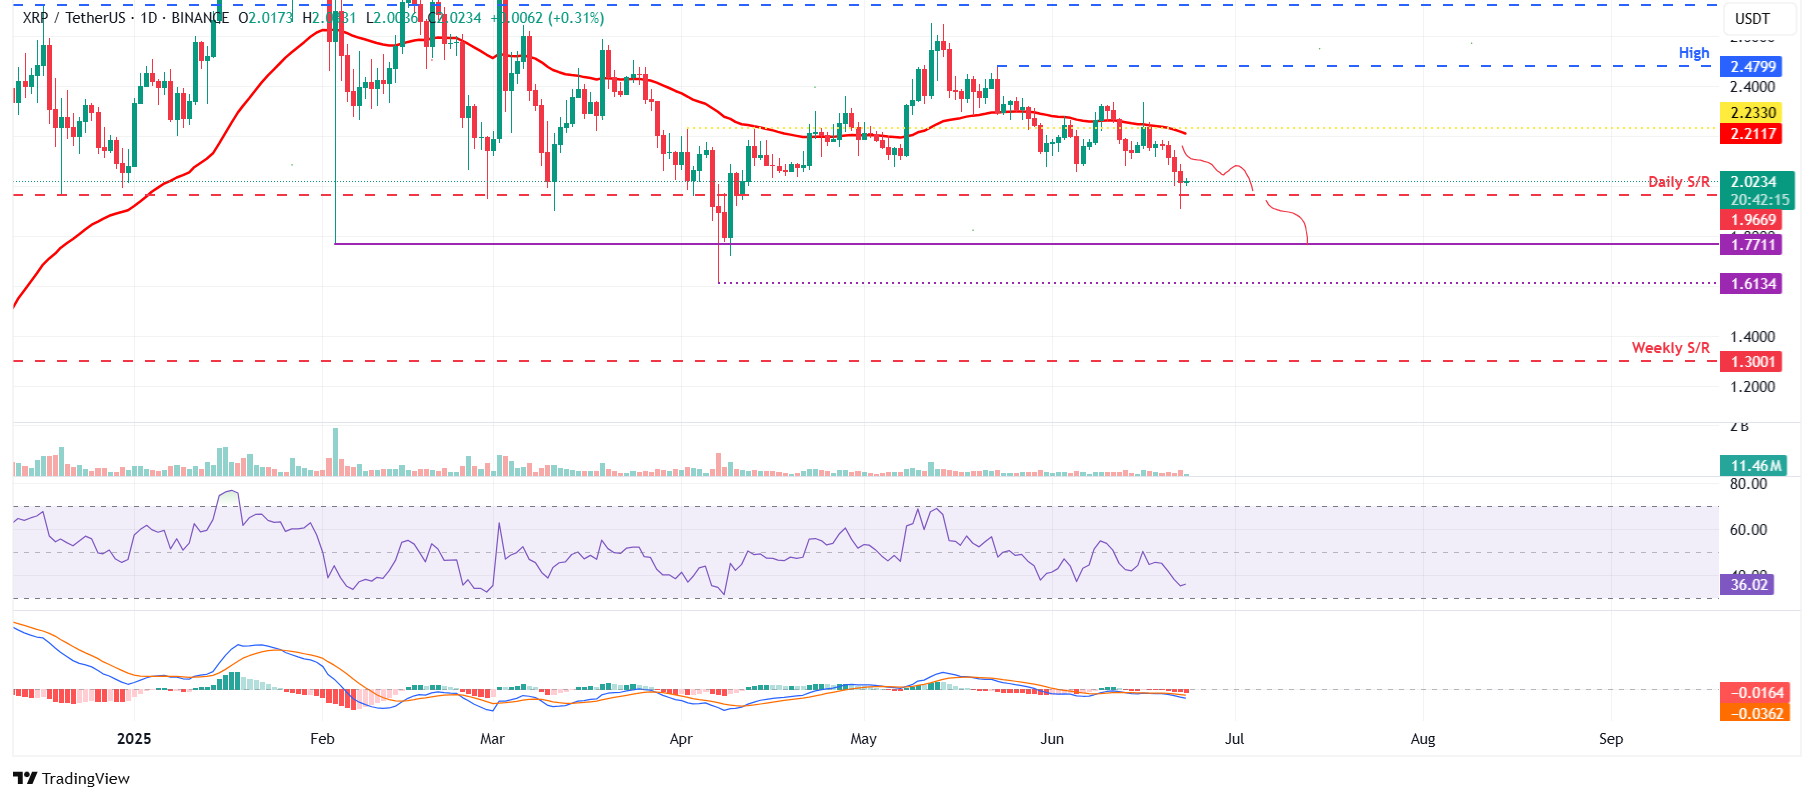
XRP/USDT daily chart
Conversely, if XRP recovers, it could extend the recovery toward its 50-day EMA at $2.21.
Bitcoin, altcoins, stablecoins FAQs
Bitcoin is the largest cryptocurrency by market capitalization, a virtual currency designed to serve as money. This form of payment cannot be controlled by any one person, group, or entity, which eliminates the need for third-party participation during financial transactions.
Altcoins are any cryptocurrency apart from Bitcoin, but some also regard Ethereum as a non-altcoin because it is from these two cryptocurrencies that forking happens. If this is true, then Litecoin is the first altcoin, forked from the Bitcoin protocol and, therefore, an “improved” version of it.
Stablecoins are cryptocurrencies designed to have a stable price, with their value backed by a reserve of the asset it represents. To achieve this, the value of any one stablecoin is pegged to a commodity or financial instrument, such as the US Dollar (USD), with its supply regulated by an algorithm or demand. The main goal of stablecoins is to provide an on/off-ramp for investors willing to trade and invest in cryptocurrencies. Stablecoins also allow investors to store value since cryptocurrencies, in general, are subject to volatility.
Bitcoin dominance is the ratio of Bitcoin's market capitalization to the total market capitalization of all cryptocurrencies combined. It provides a clear picture of Bitcoin’s interest among investors. A high BTC dominance typically happens before and during a bull run, in which investors resort to investing in relatively stable and high market capitalization cryptocurrency like Bitcoin. A drop in BTC dominance usually means that investors are moving their capital and/or profits to altcoins in a quest for higher returns, which usually triggers an explosion of altcoin rallies.
a
You May Also Like

Is Doge Losing Steam As Traders Choose Pepeto For The Best Crypto Investment?

Solana Price Prediction from Standard Chartered
