

VeChain (VET) Price Prediction 2026, 2027-2030
- Bullish VET price prediction for 2026 is $0.01885 to $0.02657.
- VeChain (VET) price might reach $0.5 soon.
- Bearish VET price prediction for 2026 is $0.00976.
In this VeChain (VET) price prediction 2026, 2027-2030, we will analyze the price patterns of VET by using accurate trader-friendly technical analysis indicators and predict the future movement of the cryptocurrency.
|
TABLE OF CONTENTS
|
|
INTRODUCTION
|
|
|
VECHAIN (VET) PRICE PREDICTION 2026
|
|
| VECHAIN (VET) PRICE PREDICTION 2027, 2028-2030 |
| CONCLUSION |
| FAQ |
VeChain (VET) Current Market Status
| Current Price | $0.01192 |
| 24 – Hour Price Change | 3.84% Up |
| 24 – Hour Trading Volume | $32.78M |
| Market Cap | $1.02B |
| Circulating Supply | 85.98B VET |
| All – Time High | $0.2782 (On Apr 17, 2021) |
| All – Time Low | $0.001678 (On Mar 13, 2020) |
What is VeChain (VET)
| TICKER | VET |
| BLOCKCHAIN | VeChainThor |
| CATEGORY | Blockchain protocol |
| LAUNCHED ON | 2015 |
| UTILITIES | Governance, Fast Transactions, gas fees & rewards |
VeChain (VET) is the native token operating on the VeChainThor, a public layer-1 blockchain. Initially, VET was launched formerly as VEN, an ERC-20 token, on the Ethereum blockchain. Later in 2018, VEN was swapped onto the VeChainThor blockchain.
VeChain is based on a two-token system that hosts the tokens, VET, and VTHO. VET is used as a payment token in the DeFi space whereas the latter serves as the energy token for facilitating the transactions. The blockchain relies on the proof-of-authority (PoA) consensus which demands validators to stake at least 25 million VET at the ‘authority master nodes’ along with providing their real identities.
VeChain 24H Technicals
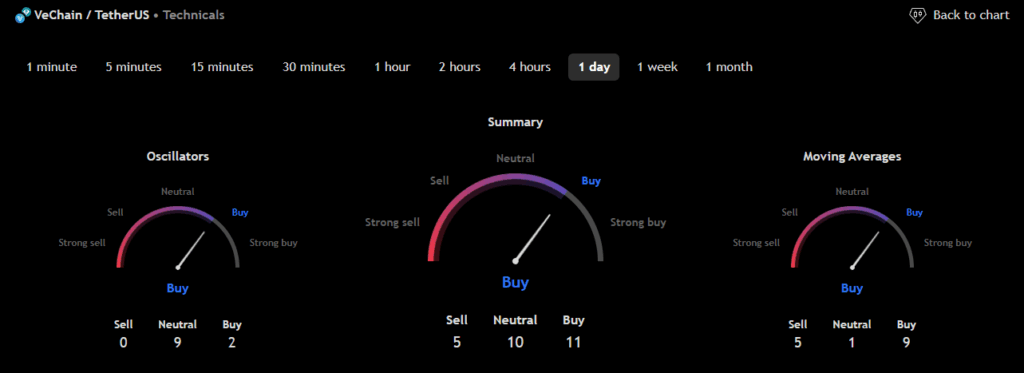 (Source: TradingView)
VeChain (VET) Price Prediction 2026
VeChain (VET) ranks 67th on CoinMarketCap in terms of its market capitalization. The overview of the VeChain price prediction for 2026 is explained below with a daily time frame.
In the above chart, VeChain (VET) laid out a Rounding Bottom pattern. The price movements form a pattern that resembles a bow and hence is also known as the saucer bottom pattern. In general, the rounding bottom pattern indicates a long-term price reversal. This pattern also highlights the shift in market sentiment, as the trend appears to transition from bearish to bullish.
Investors generally have to stay cautious and time the market well. If the price breaks and moves past the resistance level, it will enter a confirmed bullish trajectory.
At the time of analysis, the price of VeChain (VET) was recorded at $0.01192. If the pattern trend continues, then the price of VET might reach the resistance levels of $0.01904 and $0.02675. If the trend reverses, then the price of VET may fall to the support of $0.01632 and $0.01305.
VeChain (VET) Resistance and Support Levels
The chart given below elucidates the possible resistance and support levels of VeChain (VET) in 2026.
From the above chart, we can analyze and identify the following as resistance and support levels of VeChain (VET) for 2026.
| Resistance Level 1 | $0.01885 |
| Resistance Level 2 | $0.02657 |
| Support Level 1 | $0.01332 |
| Support Level 2 | $0.00976 |
VET Resistance & Support Levels
VeChain (VET) Price Prediction 2026 — RVOL, MA, and RSI
The technical analysis indicators such as Relative Volume (RVOL), Moving Average (MA), and Relative Strength Index (RSI) of Bitcoin (VET) are shown in the chart below.
From the readings on the chart above, we can make the following inferences regarding the current VeChain (VET) market in 2026.
| INDICATOR | PURPOSE | READING | INFERENCE |
| 50-Day Moving Average (50MA) | Nature of the current trend by comparing the average price over 50 days | 50 MA = $0.01873Price = $0.01702 (50MA > Price) | Bearish/Downtrend |
| Relative Strength Index (RSI) | Magnitude of price change;Analyzing oversold & overbought conditions | 49.58490 <30 = Oversold 50-70 = Neutral>70 = Overbought | Nearly Oversold |
| Relative Volume (RVOL) | Asset’s trading volume in relation to its recent average volumes | Below cutoff line | Weak volume |
VeChain (VET) Price Prediction 2026 — ADX, RVI
In the below chart, we analyze the strength and volatility of VeChain (VET) using the following technical analysis indicators — Average Directional Index (ADX) and Relative Volatility Index (RVI).
From the readings on the chart above, we can make the following inferences regarding the price momentum of VeChain (VET).
| INDICATOR | PURPOSE | READING | INFERENCE |
| Average Directional Index (ADX) | Strength of the trend momentum | 32.63995 | Strong Trend |
| Relative Volatility Index (RVI) | Volatility over a specific period | 56.79 <50 = Low >50 = High | High volatility |
Comparison of VET with BTC, ETH
Let us now compare the price movements of VeChain (VET) with that of Bitcoin (BTC), and Ethereum (ETH).
From the above chart, we can interpret that the price action of VET is similar to that of BTC and ETH. That is, when the price of BTC and ETH increases or decreases, the price of VET also increases or decreases, respectively.
VeChain (VET) Price Prediction 2027, 2028 – 2030
With the help of the aforementioned technical analysis indicators and trend patterns, let us predict the price of VeChain (VET) between 2027, 2028, 2029, and 2030.
| Year | Bullish Price | Bearish Price |
| VeChain (VET) Price Prediction 2026 | $0.7 | $0.008 |
| VeChain (VET) Price Prediction 2027 | $0.9 | $0.007 |
| VeChain (VET) Price Prediction 2028 | $1 | $0.006 |
| VeChain (VET) Price Prediction 2029 | $1.3 | $0.005 |
Conclusion
If VeChain (VET) establishes itself as a good investment in 2026, this year would be favorable to the cryptocurrency. In conclusion, the bullish VeChain (VET) price prediction for 2026 is $0.02657. Comparatively, if unfavorable sentiment is triggered, the bearish VeChain (VET) price prediction for 2026 is $0.00976.
If the market momentum and investors’ sentiment positively elevates, then VeChain (VET) might hit $0.5. Furthermore, with future upgrades and advancements in the VeChain ecosystem, VET might surpass its current all-time high (ATH) of $0.2782 and mark its new ATH.
FAQ
1. What is VeChain (VET)?
VeChain (VET) is the native token operating on the VeChainThor, a public layer-1 blockchain. It migrated from the Ethereum blockchain to its independent blockchain in 2018. VeChain provides blockchain-based tracking systems to supply chain enterprises.
2. Where can you purchase VeChain (VET)?
VeChain (VET) has been listed on many crypto exchanges which include Binance, Bybit, DigiFinex, CoinTR Pro, and AscendEX (BitMax).
3. Will VeChain (VET) reach a new ATH soon?
With the ongoing developments and upgrades within the VeChain Platform, VET has a high possibility of reaching its ATH soon.
4. What is the current all-time high (ATH) of VeChain (VET)?
On Apr 17, 2021, VeChain (VET) reached its new all-time high (ATH) of $0.2782.
5. What is the lowest price of VeChain (VET)?
According to CoinMarketCap, VET hit its all-time low (ATL) of $0.001678, On Mar 13, 2020.
6. Will VeChain (VET) reach $0.5?
If VeChain (VET) becomes one of the active cryptocurrencies that maintains a bullish trend, it might rally to hit $0.5 soon.
7. What will be VeChain (VET) price by 2027?
VeChain (VET) price is expected to reach $0.7 by 2027.
8. What will be VeChain (VET) price by 2028?
VeChain (VET) price is expected to reach $0.9 by 2028.
9. What will be VeChain (VET) price by 2029?
VeChain (VET) price is expected to reach $1 by 2029
10. What will be VeChain (VET) price by 2030?
VeChain (VET) price is expected to reach $1.3 by 2029.
Top Crypto Predictions
BOOK OF MEME (BOME) Price Prediction
NEAR Protocol (NEAR) Price Prediction
Cronos (CRO) Price Prediction
Disclaimer: The opinion expressed in this chart is solely the author’s. It does not represent any investment advice. TheNewsCrypto team encourages all to do their own research before investing.
You May Also Like

GCC and India to sign terms for start of free trade talks

PEPE Holders Looking For The Next 100x Crypto Set Their Sights On Layer Brett Presale
