

XRP Price Prediction Faces Pressure as Support Holds Amid On-Chain Shifts
The XRP price prediction is being monitored as the XRP price is trading close to an important technical support level while the broader market indicators are showing mixed signals. The price is showing consolidation as the price has been declining. Additionally, the on-chain data from Glassnode is showing that the price is making changes in line with the trading range. Market participants are looking at the price and the blockchain data for the market direction. Moreover, the comments from analysts on social media are also being considered while looking at the price.
XRP Price Structure Signals Ongoing Consolidation
The XRP price prediction indicates that the market is holding above a specific support level, as attempts to fall below this level have not seen any follow-through. The price on the daily chart is seen to be respecting the lower trend, as the attempts to move upwards are being met by resistance at the lower levels.
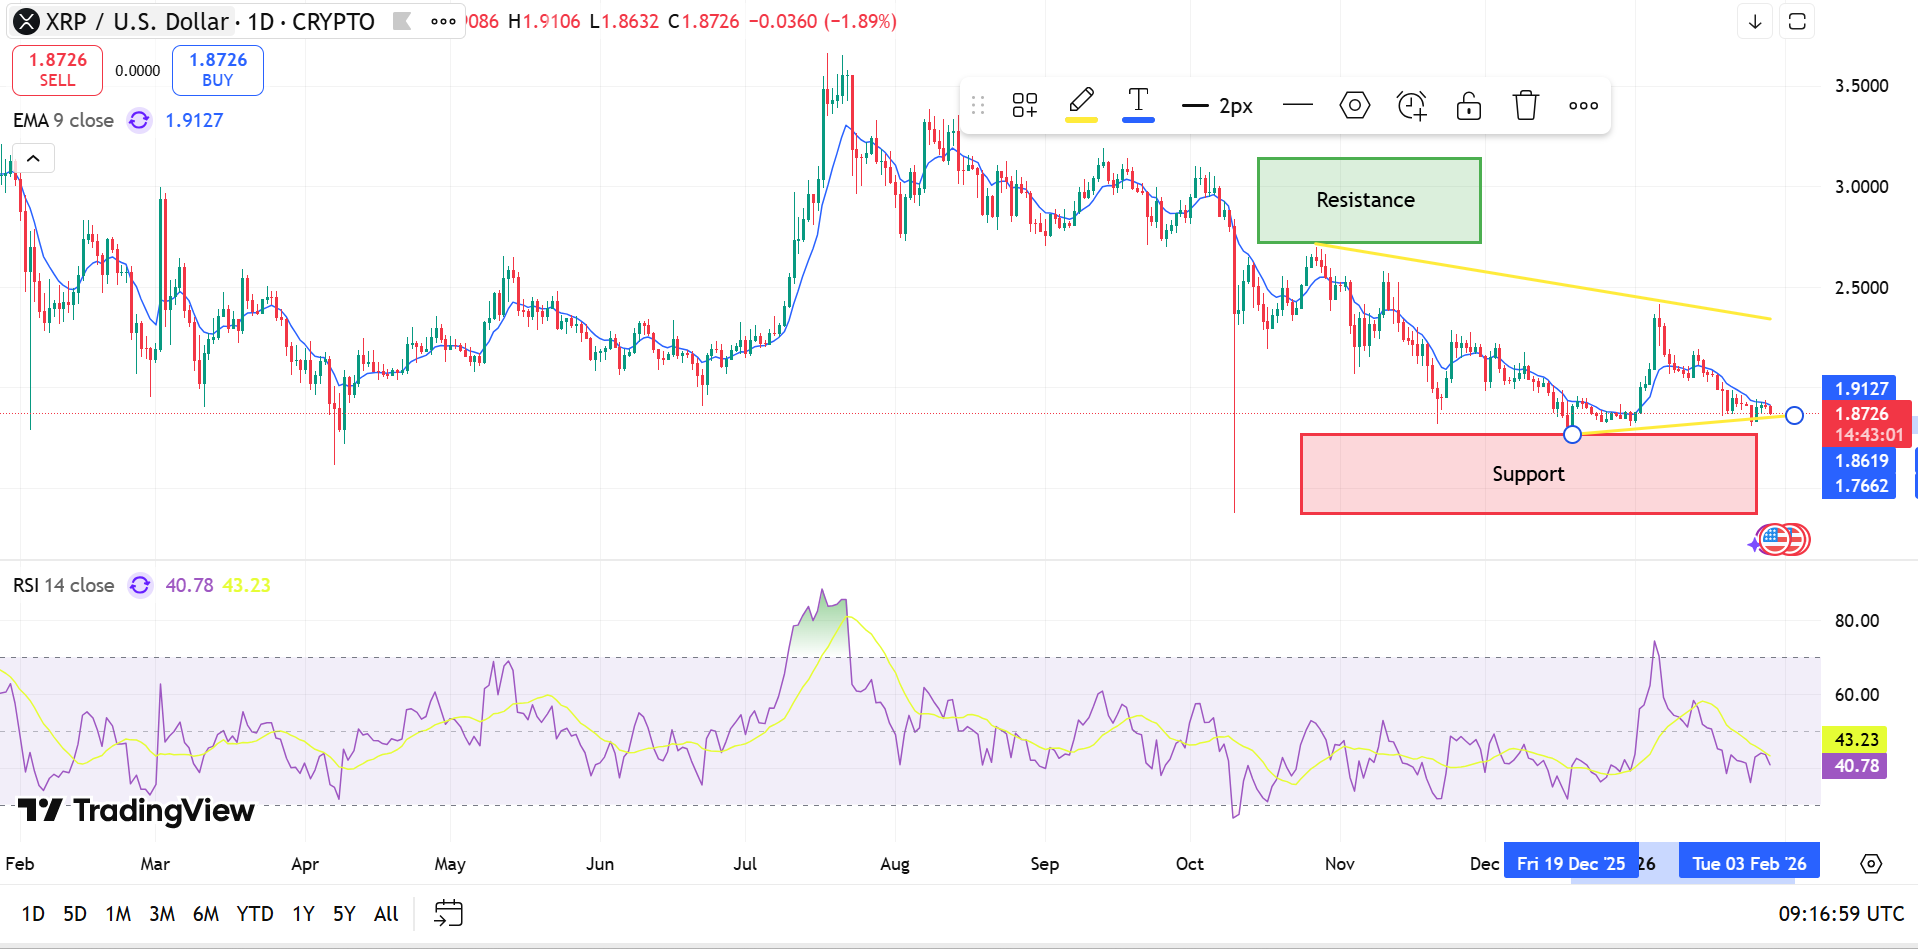 XRP’s 1D Chart
In the short-term charts, the price compression is still evident, and the XRP is seen to be moving in a consolidating range, as the buyers are holding the support and the sellers are holding the trend resistance. The momentum indicators, including the relative strength index, remain below the midline, and the direction is still uncertain, as no side is seen to be dominant.
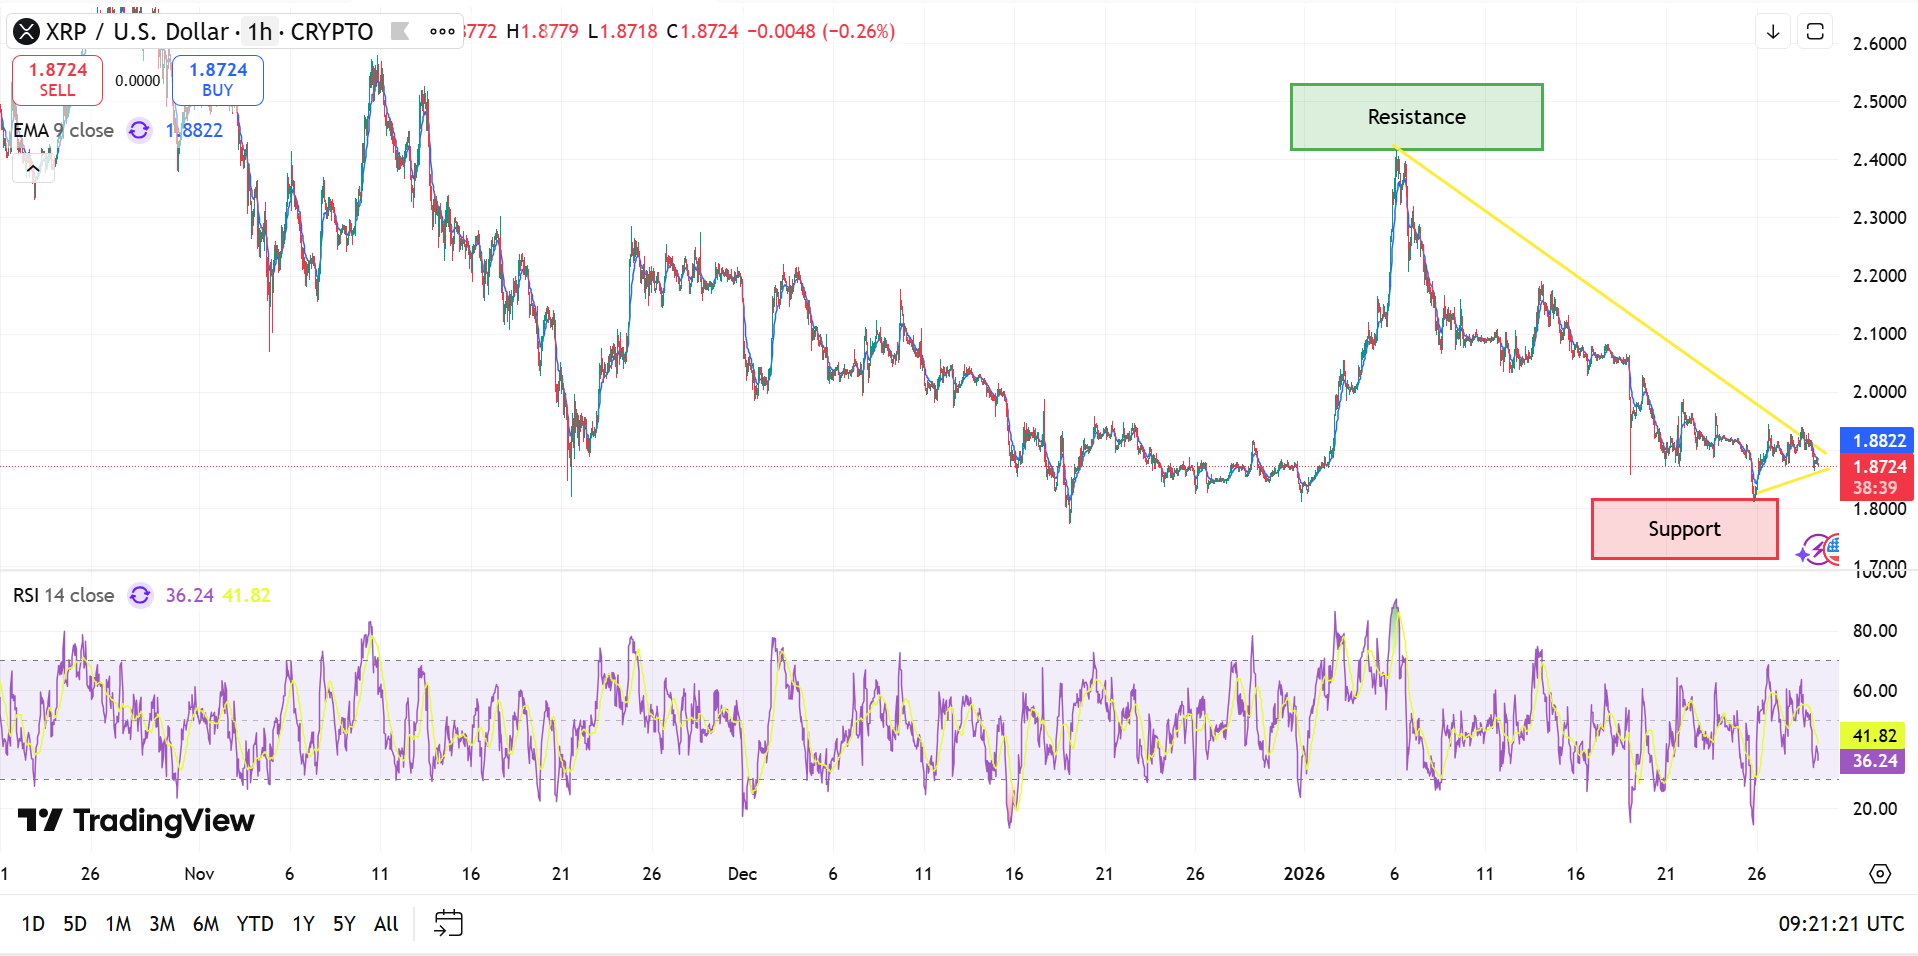 XRPs 1H chart
Support and Resistance Shape the XRP Price Prediction
Support areas between the range of the mid-$1.70 and $1.80 continue to show buying interest. Each time the asset has been tested within the range, short-term reactions have occurred. However, these short-term reactions have not been strong enough to cause a breakdown.
Resistance areas for the asset are also seen as a descending trendline and a distribution range. XRP has been unable to close above the resistance range on higher timeframes. This continues to hold the current XRP price prediction within a range.
On-Chain Data Shows Shifts in Network Activity
Glassnode statistics on XRP’s market capitalization reveal stabilization after previous corrections. The rate at which capital was leaving the market slowed down due to the stabilization of the market capitalization within a specific range. This indicates that the price is consolidating.
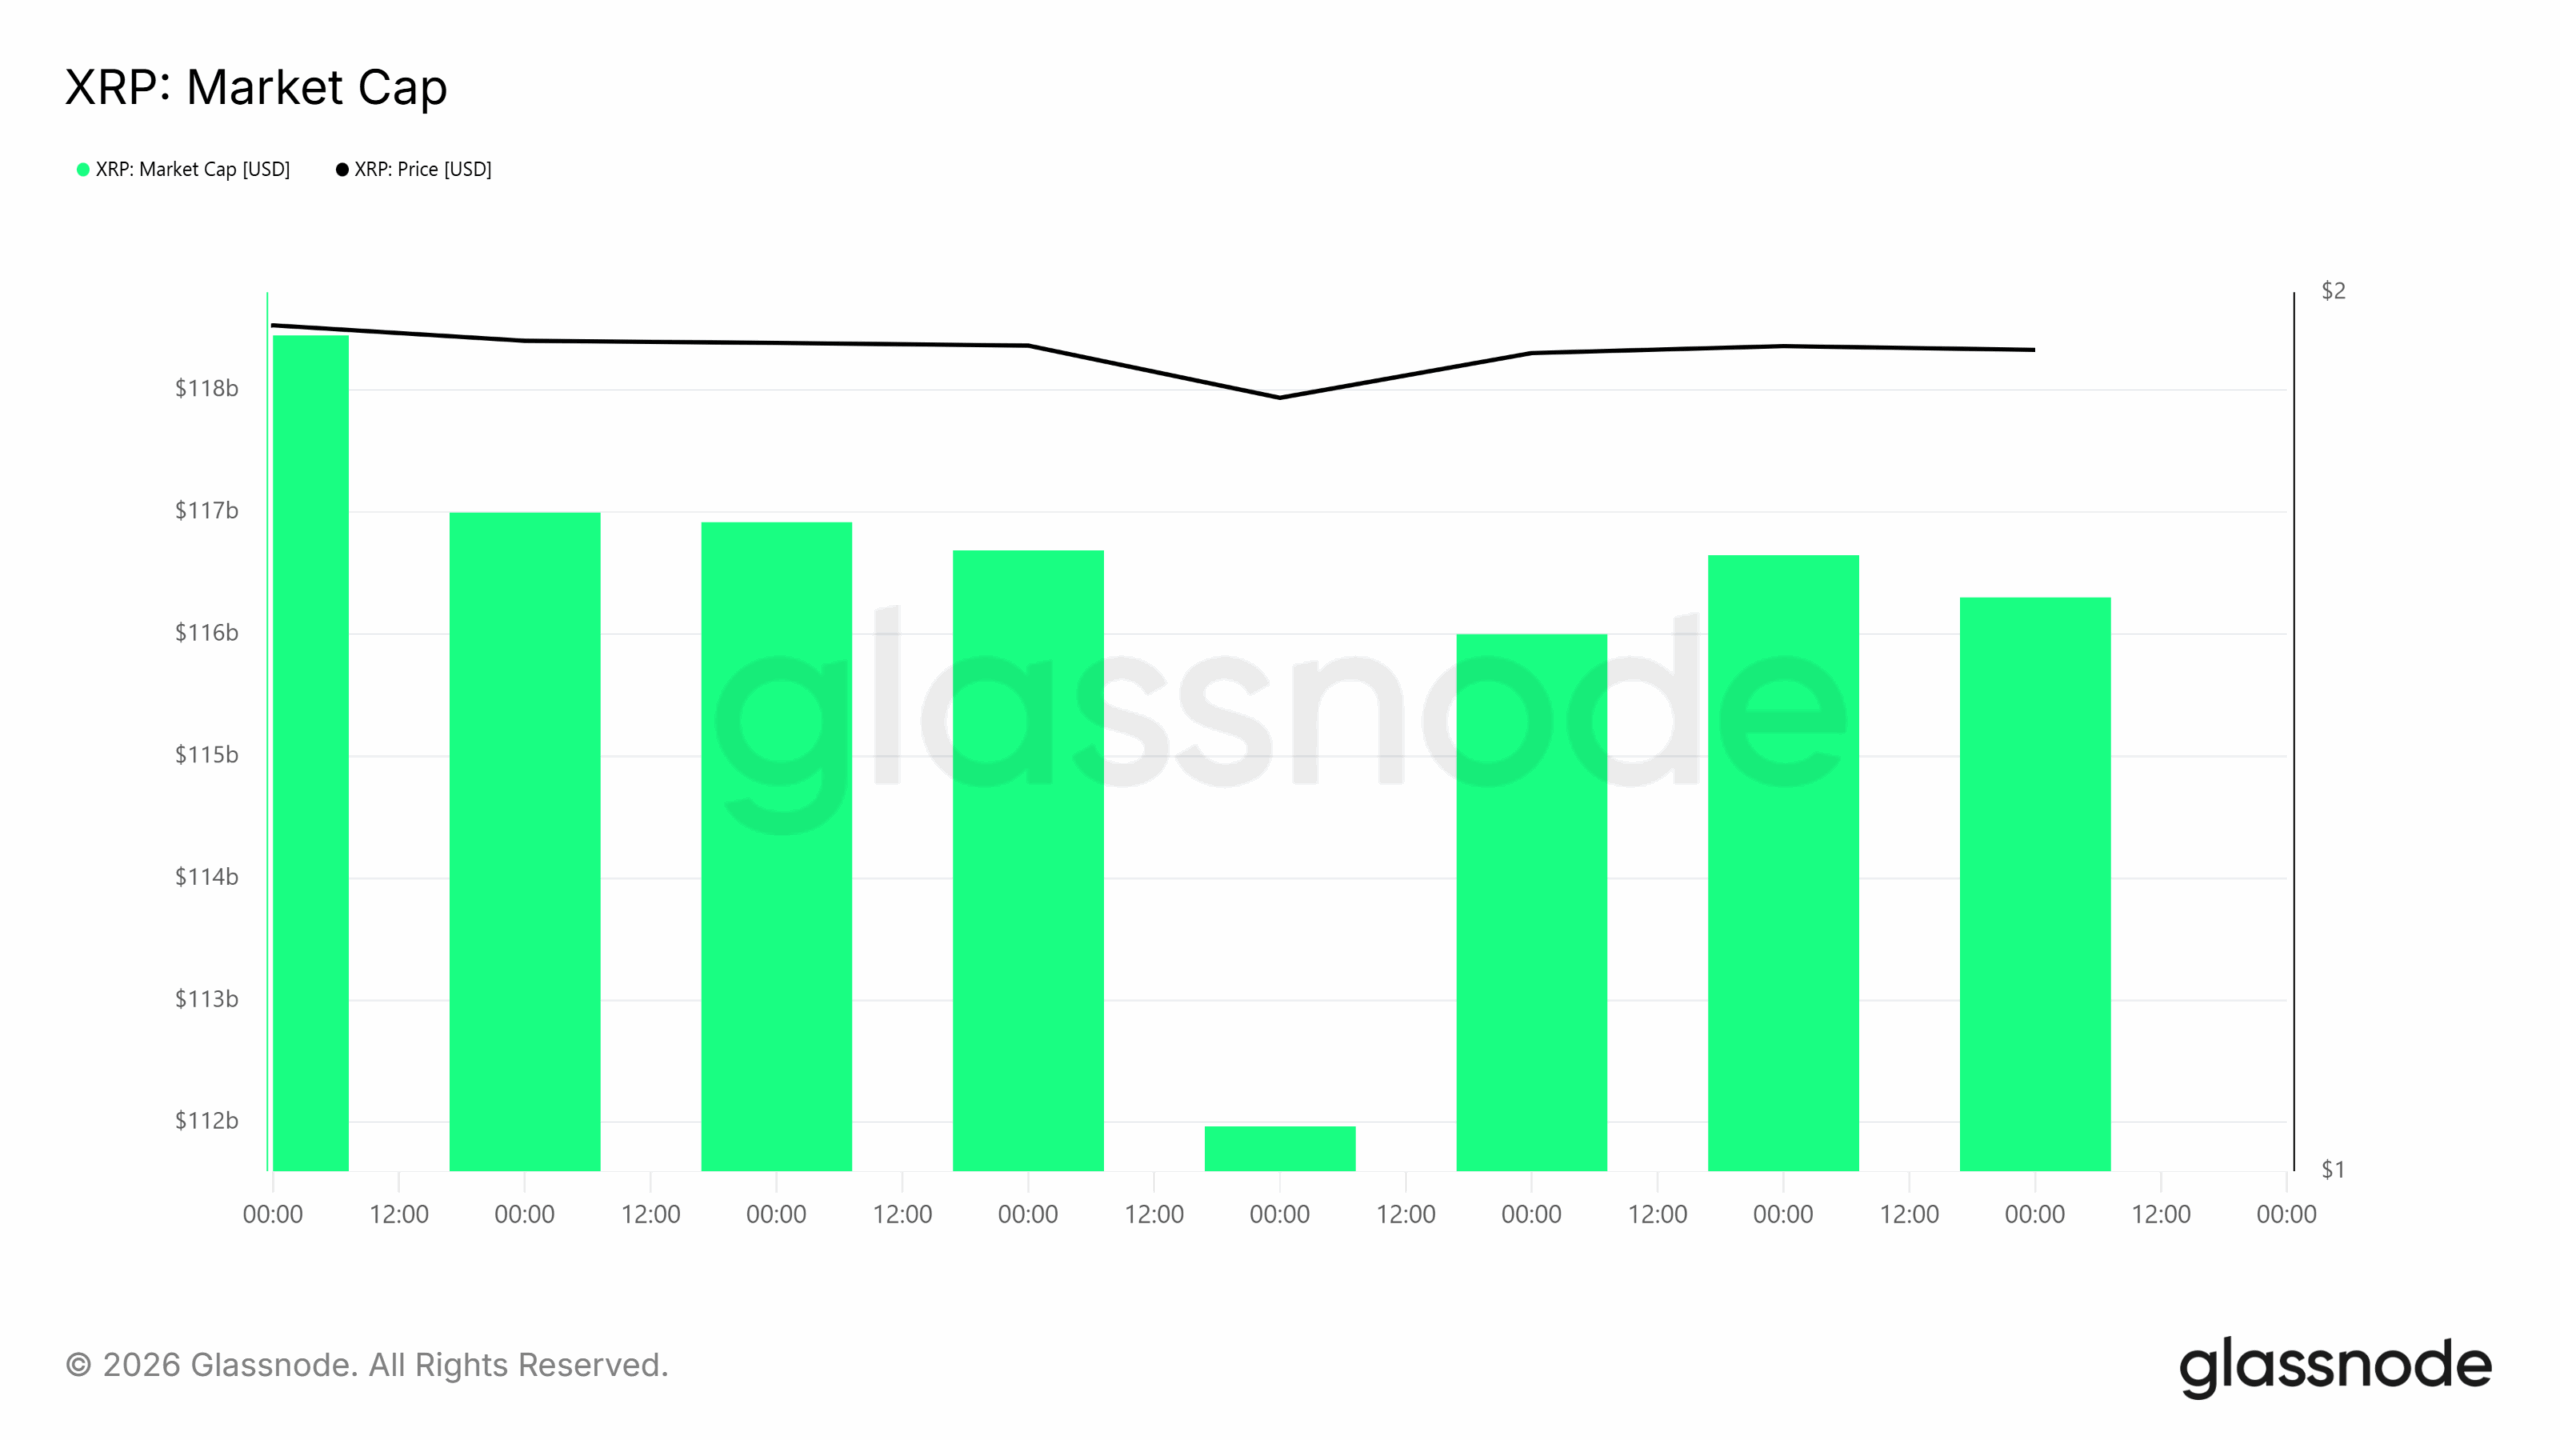 XRPs Market Cap
Participatory metrics for the XRP network reveal significant movements. Active addresses were increasing at the start of the period before declining significantly.
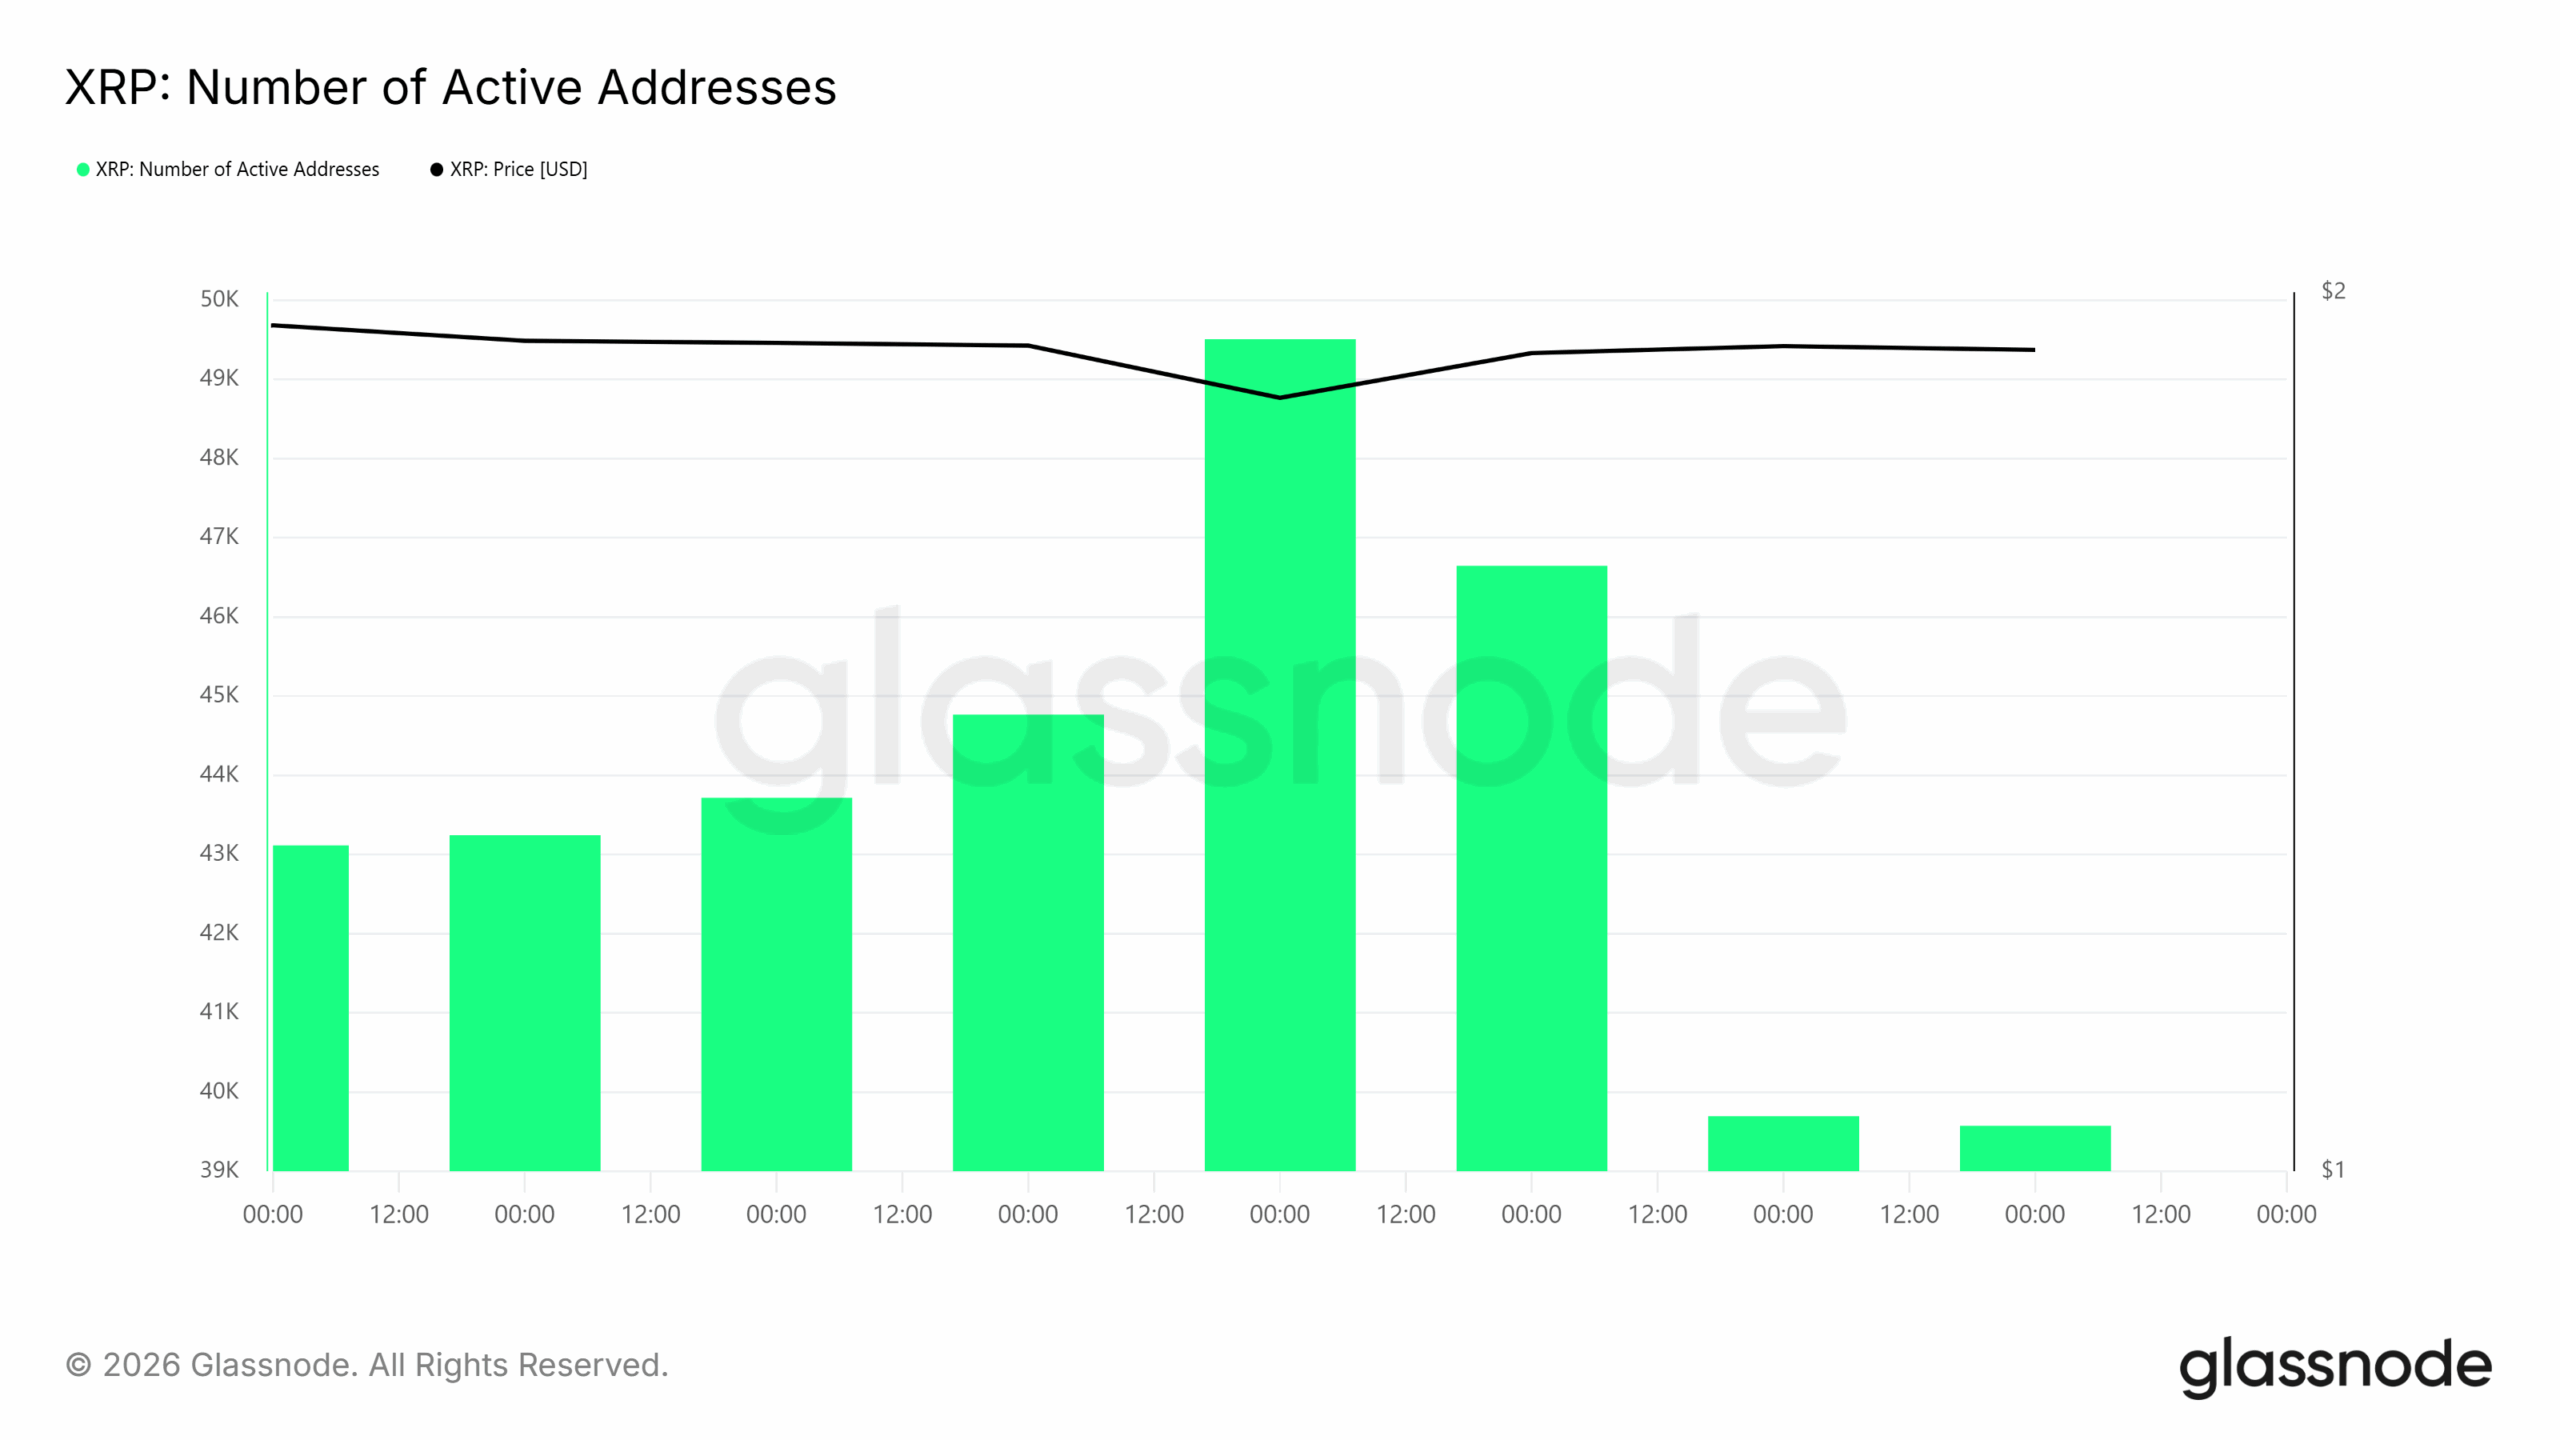 XRPs Number of Active Addresses
Transaction counts were fluctuating with small spikes, yet they failed to grow significantly. This indicates that the current price prediction for XRP is correct.
Analyst Commentary Adds Context to XRP Outlook
Market discussions on social media have centered around XRP’s inability to overcome resistance levels. Market analysts have pointed out that the inability of XRP to overcome descending trendlines has limited the potential of other related assets. This is consistent with the current chart structure.
Other analysts have pointed out that confirmed closes above resistance levels should be considered before making any projections. This is consistent with the general market approach, which is focused on confirmation.
The XRP price prediction is still based on levels and data, as opposed to direction.
The XRP price is still contained within a controlled range as price structure, support, and on-chain metrics align. Market participants remain focused on confirmed moves as this is the current market approach.
Disclaimer: This analysis is based on market trends and does not guarantee future results. It should not be treated as financial advice. Cryptocurrency investments involve risk, so always do your own research (DYOR) before investing.
You May Also Like

Galaxy Digital’s 2025 Loss: SOL Bear Market

Why This New Trending Meme Coin Is Being Dubbed The New PEPE After Record Presale
