

Bitcoin Dips to Yearly Low as Leverage Unwinds Under $85K

Bitcoin started the year with momentum but has since reversed course, slipping to a yearly low below 84,000 as futures deleveraging pressured prices. Analysts say the move reflects a broader corrective regime rather than a structural market breakdown, driven more by leverage in the derivatives space than by fresh selling in spot markets. The slide has erased early-year gains and raised questions about how long the current pullback may persist as liquidity conditions remain uneven and risk appetite shifts across trading venues.
Key takeaways
- Bitcoin touched 83,600, testing the lower bound of a 10-week consolidation range that has framed price action since mid-November 2025.
- Taker sell volume surged to about $4.1 billion in a two-hour window across multiple exchanges, underscoring futures-driven pressure rather than broad spot selling.
- The decline wiped roughly $570 million in long positions, illustrating how leveraged bets amplified the move during New York trading hours.
- Analysts view the action as a corrective unwind within a longer-term regime, with attention turning to whether buyers can defend key support levels in the near term.
Tickers mentioned: $BTC
Sentiment: Neutral
Price impact: Negative. The slide from about $88,000 to the mid-$83,000s marked a sharp move that compressed long-position exposure and raised the prospect of further retracements if support gives way.
Market context: The move aligns with a broader pattern of leverage unwinds in crypto markets, where futures-driven dynamics and liquidity conditions continue to shape price responses even as spot demand shows episodic support.
Why it matters
The latest price action highlights how Bitcoin remains sensitive to the balance between leveraged risk in the futures market and underlying spot demand. When taker sell pressure spikes, it often signals a liquidity-driven adjustment rather than a fundamental shift in long-term value. The swift capitulation to 83,600 and the subsequent pressure on surrounding support levels test traders’ confidence in a swift rebound, especially given the documented trend of heavy derivatives activity that has previously preceded volatility spikes.
From a risk-management perspective, the episode serves as a reminder that even in a market displaying periods of resilience, a sizable chunk of the recent price action has been driven by leverage unwinds. The $4.1 billion in taker sell volume observed over a short window points to rapid hedging and forced liquidations that can overshoot near-term price targets. For investors and funds, the event underscores the importance of margin discipline and the need to monitor changes in futures open interest as potential early signals of how much longer the current correction might endure.
On-chain and derivatives data have repeatedly shown that these episodes are not simply about a cascade of steady selling. Rather, they are often concentrated events that reflect a shift in risk sentiment among large market players. The Lookonchain update, citing a prominent trader nicknamed BitcoinOG, illustrated the scale of losses incurred by a single actor whose positions swung dramatically over two weeks, illustrating how outsized strategies can amplify drawdowns during downturns. Such instances underscore the dialog between on-chain activity and derivatives markets in mapping the health of the broader ecosystem during periods of stress.
Bitcoin Taker Sell Volume. Source: CryptoQuantThe price action has kept Bitcoin (BTC) within a defined range since mid-November, with weekly closes historically capped between roughly $94,000 and $84,000. The latest test near the lower boundary raises the prospect of a deeper pullback if buyers fail to defend key support levels, though many expect a rebound to materialize once liquidity improves and risk appetite stabilizes. In addition to the immediate price dynamics, derivatives metrics have shown that declines in open interest have tended to align with local price lows, suggesting that the current leg of weakness may be more about leverage unwinding than a sustained trend reversal.
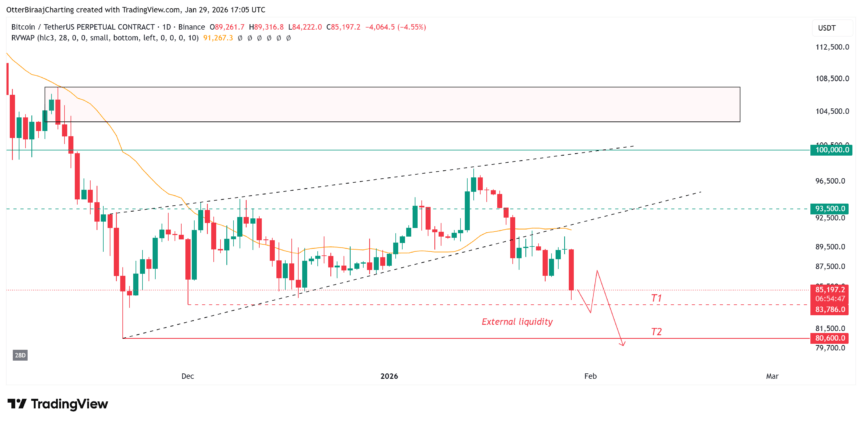 Bitcoin one-day chart. Source: Cointelegraph/TradingView
Analysts have anchored their broad interpretation in the context of a broader macro view: after a strong expansion phase in mid-2025, returns have cooled, and near-term momentum appears to have shifted toward a more cautious posture. The interplay between leveraged bets and spot purchases is a recurring theme in such environments, where price action can swing rapidly on hedging activity and shifting risk tolerances rather than on fundamental changes in cryptocurrency adoption or use cases. In several notable instances, declines in futures open interest have coincided with local price bottoms, underscoring the tendency for pullbacks to be driven by forced liquidations rather than a wholesale shift in investor sentiment.
As the market digests the latest move, participants will be watching how the price behaves around the 84,000 level and whether demand at that juncture can absorb the selling pressure without triggering another wave of margin calls. The dynamic remains a reminder that liquidity conditions and risk-off sentiment continue to play a central role in crypto markets, even as the underlying technology and use cases for Bitcoin (BTC) persist to evolve in the long run.
Where the story goes next
Next steps include monitoring whether the price can reclaim the 84,000–85,000 zone and whether any shift in futures activity signals a renewed appetite to push higher. Traders will likely scrutinize open interest dynamics for further signs of whether the recent deleveraging has run its course or if additional downside risk remains. On-chain indicators, particularly taker-volume metrics and liquidation data, will help gauge the severity and duration of the current contraction in leverage. In addition, any regulatory or macro catalysts that alter liquidity or market structure could accelerate or dampen the next phase of Bitcoin’s price journey.
What to watch next
- Watch for a test of the 84,000 level over the next few sessions and assess whether buyers step in to defend it.
- Monitor futures open interest changes for signs of renewed leverage risk or relief rallies.
- Track on-chain taker volumes and liquidation flows to gauge the persistence of selling pressure.
- Look for any liquidity-led regime shifts that could yield a stronger rebound if marketmakers return to more favorable risk conditions.
Sources & verification
- CryptoQuant data on taker sell volume, highlighting the roughly $4.1 billion spike in a two-hour window across exchanges.
- Lookonchain post documenting the losses of a prominent trader nicknamed BitcoinOG during the recent pullback.
- Cointelegraph price analysis visuals and TradingView data referenced in the daily and weekly charts.
- Observed range boundaries since November 17, 2025, defining the current 10-week consolidation zone.
This article was originally published as Bitcoin Dips to Yearly Low as Leverage Unwinds Under $85K on Crypto Breaking News – your trusted source for crypto news, Bitcoin news, and blockchain updates.
You May Also Like

Galaxy Digital’s 2025 Loss: SOL Bear Market

Why This New Trending Meme Coin Is Being Dubbed The New PEPE After Record Presale
