Solana (SOL) Price: Token Drops to $112 as Market Pullback Tests Key Support Levels
TLDR
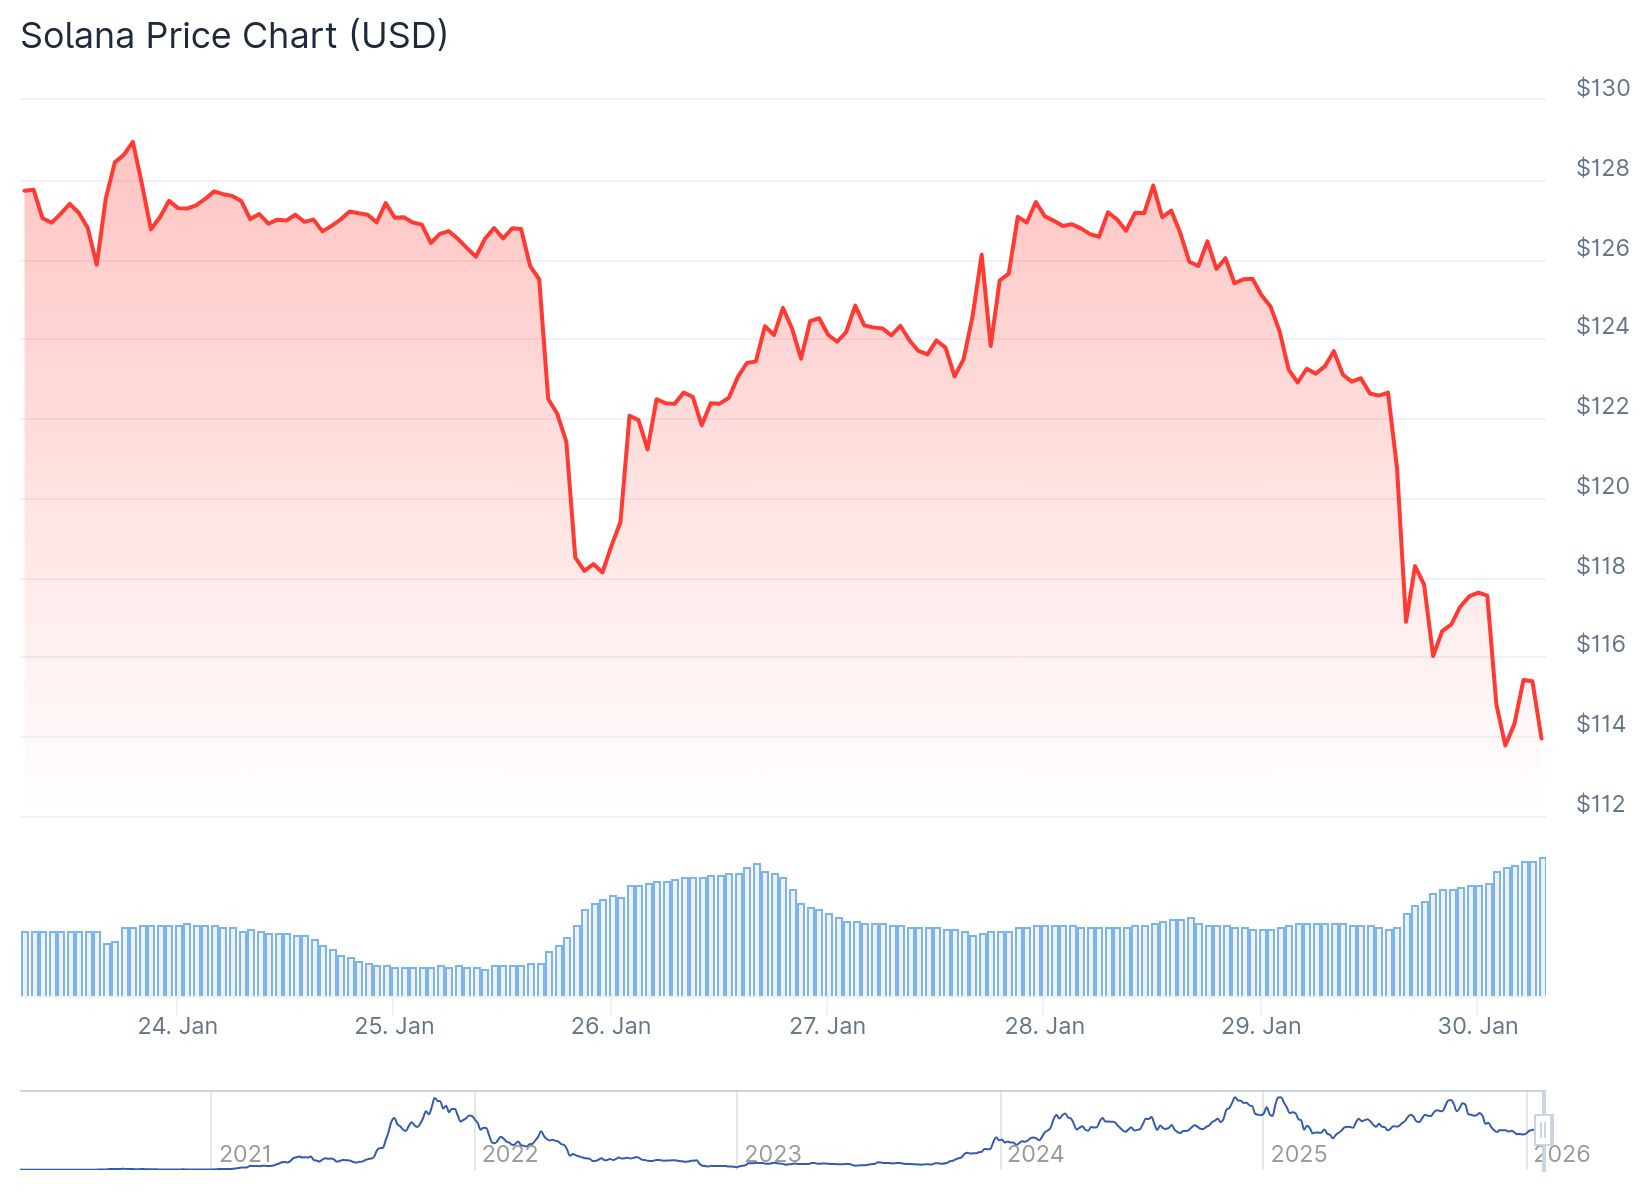
- Solana (SOL) dropped 7.5% to around $114 on January 30, 2026, falling below key resistance at $120
- The price declined from $128 to a low of $112, with immediate resistance at $116 and major resistance at $120-$122
- SOL maintains a market cap near $64.5 billion and ranks as the seventh-largest crypto asset despite the downturn
- Total value locked on Solana DeFi reached $9 billion while spot ETF products logged eight consecutive weeks of inflows
- Key support levels sit at $112 and $105, with a break below potentially pushing SOL toward $102
Solana closed January 30, 2026 trading at approximately $113.80 after dropping 7.6% in 24 hours. The decline pushed SOL below the $120 threshold and the 100-hourly simple moving average.
 Solana (SOL) Price
The cryptocurrency fell from a swing high of $128 to a low of $112 during the session. The 24-hour trading range stretched between $113.10 and $123.70 as selling pressure intensified across major crypto assets.
Bitcoin dropped to around $82,000 while Ethereum declined to near $2,730 during the same period. The broader market pullback affected high-growth altcoins including Solana.
Daily trading volume for SOL remained elevated above $7 billion. This indicates active repositioning rather than low liquidity conditions.
Solana’s market capitalization stands at roughly $64.5 billion. This ranks the token as the seventh-largest cryptocurrency by market value.
Price Levels and Technical Structure
A bearish trend line has formed with resistance at $116 on the hourly chart. The price recovered slightly from the $112 low and climbed toward the 23.6% Fibonacci retracement level.
The next major resistance sits at $120, which corresponds to the 50% Fibonacci retracement level. A move above $120 would target the $122 level.
Breaking above $122 could open the path toward $125 and potentially $132. However, failure to clear $116 resistance may extend losses.
Initial downside support is located near $114. The first major support zone is at $112, where the recent low formed.
A break below $112 could send SOL toward $105. Further declines below $105 might target the $102 support level in the near term.
On-Chain Metrics and ETF Flows
Total value locked in Solana DeFi protocols climbed to approximately $9 billion. Active addresses on the network rose toward 3.8 million in early January.
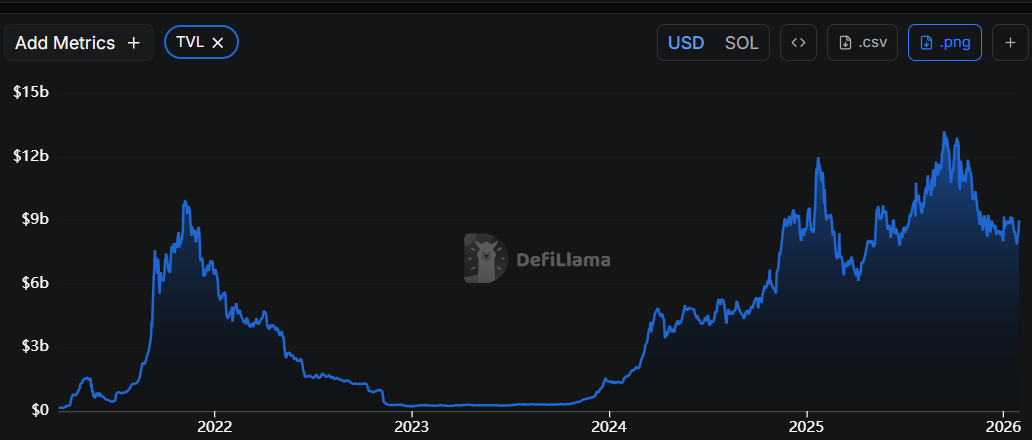 Source: DefiLlama
Spot Solana ETF products recorded roughly eight consecutive weeks of net inflows. Weekly inflows recently totaled just over $41 million, showing continued institutional interest.
Open interest in SOL futures reached between $7.9 billion and $8 billion in early 2026. Short positions made up just over 52% of open interest according to derivatives data.
Funding rates averaged around 0.46% on a periodic basis, indicating a persistent long bias among traders. Stablecoin supply on the Solana network sits at approximately $15 billion.
Network Development
Infrastructure improvements continue with the Firedancer validator client designed to reduce congestion. The upgrade aims to address past network outages that affected user confidence.
Real-world asset initiatives and stablecoin liquidity expansion are positioning Solana as a high-throughput settlement layer. Traditional financial managers have supported these developments.
The cryptocurrency had been consolidating in a falling wedge pattern around the $120 area before the recent decline. The $120-$123 range acted as support throughout January before breaking lower.
Solana began 2026 trading in the $127-$135 range and remains above its December lows. The token is now testing whether it can hold the $110-$120 support band that defined the start of the year’s rebound.
The post Solana (SOL) Price: Token Drops to $112 as Market Pullback Tests Key Support Levels appeared first on CoinCentral.
You May Also Like

The Giants Are Stumbling: Why BlockDAG’s 20-Exchange Launch is the Market’s New Safe Haven
XRP Locked In DeFi Continues To Rise Across The Ecosystem – Here’s How Much