

Late-stage downtrend for Beam crypto (BEAMUSDT) as sellers tire near the $0.07 base

Sentiment is locked in extreme fear as Beam crypto (BEAMUSDT) grinds sideways near key support, with volatility compressing and sellers looking increasingly exhausted.
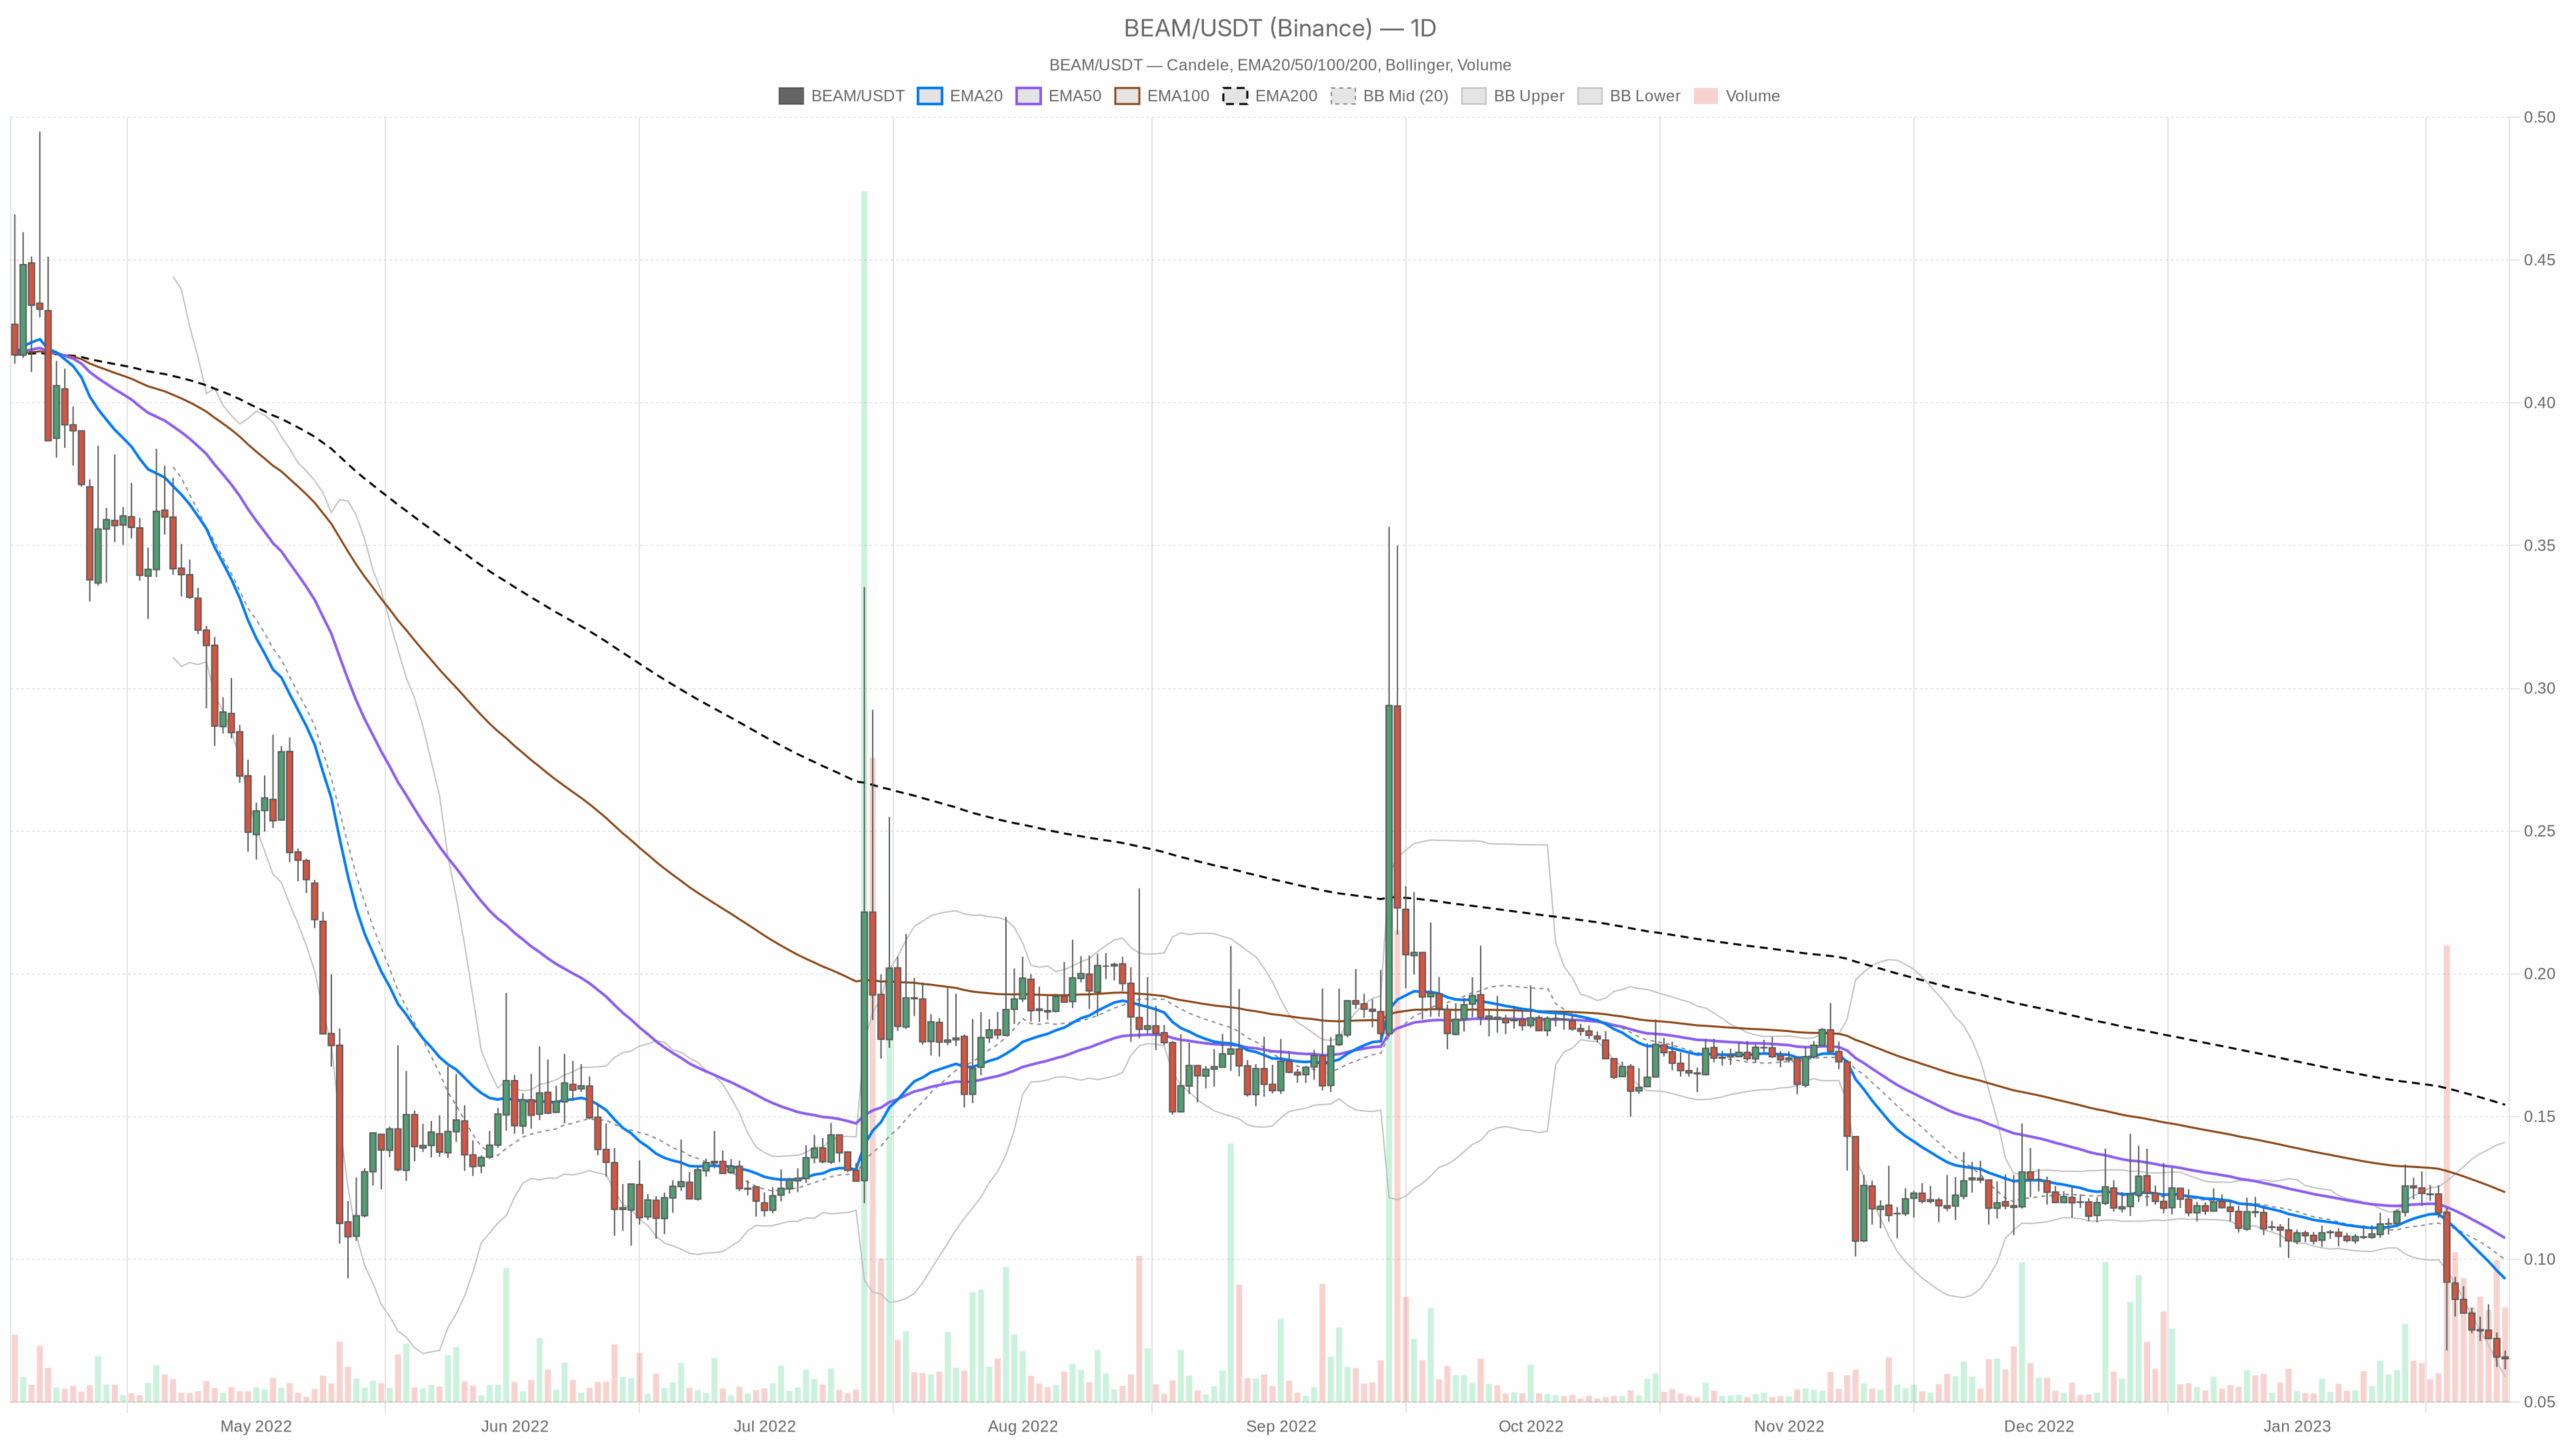 BEAM/USDT — daily chart with candlesticks, EMA20/EMA50 and volume.
Daily trend (D1): clearly bearish, but deeply oversold
On the daily timeframe, BEAMUSDT trades around $0.07, well below all key moving averages and below the mid-line of its Bollinger Bands. Structurally, this is a mature downtrend, not a fresh one.
EMAs (20 / 50 / 200): trend pressure still down
The daily EMAs line up as follows:
- Price (close): $0.07
- EMA 20: $0.09
- EMA 50: $0.11
- EMA 200: $0.15
Price is below the 20, 50, and 200 EMAs with a clear bearish stacking (20 < 50 < 200 in terms of recency). That signals an established downtrend with sellers in control on all major horizons. The gap to the 200 EMA is wide, which shows how far Beam has fallen from its longer-term mean.
When price sits this far under the 200 EMA, you are either in the middle of a structural breakdown or approaching the tail end of one. In that phase, mean-reversion rallies can be violent but short-lived.
RSI (14): extreme oversold and stretched
The daily RSI is at 19.2, deep into oversold territory.
This reading is rare and typically not sustainable for long. It tells us the selling has been one-sided and aggressive, but it also means the downside fuel is starting to run low. Each extra leg down demands new sellers, and at RSI < 20, those new sellers tend to be late arrivals.
In simple terms, the trend is still down, but the risk of either a sharp short-covering bounce or a final capitulation spike is rising.
MACD: momentum bearish, but no fresh impulse
On the daily chart:
- MACD line: -0.01
- Signal line: -0.01
- Histogram: ~0
MACD is negative, confirming the bearish regime, but the line and signal are effectively on top of each other and the histogram is flat. That means downside momentum has faded. The trend is down, but it is losing energy rather than accelerating.
This fits with the RSI story. Sellers have done a lot of work already, and the market is closer to a pause or reversal attempt than to the start of a new leg.
Bollinger Bands: pinned near the lower side of the range
Daily Bollinger Bands:
- Middle band (20SMA proxy): $0.10
- Upper band: $0.14
- Lower band: $0.06
- Price: $0.07
Price is trading between the lower band and mid-line, leaning to the downside but not riding the band anymore. Earlier, hugging the lower band would have indicated active sell pressure. Now, hovering just above $0.06–0.07 shows the market is consolidating near the lows instead of plunging through them.
That is often a staging area. Either the band widens again on a final breakdown, or price drifts back toward the mid at $0.10 in a mean-reversion bounce.
ATR (14): volatility compression at the lows
The daily ATR is about $0.01 on a $0.07 asset.
Relative to price, that is modest but not extreme. What matters is that volatility is no longer expanding. After heavy liquidations across crypto, the fact that Beam’s daily range has cooled suggests two things: participants are cautious, and liquidity is thin.
This kind of low-volatility base after a drop can precede either a volatility expansion to the downside (capitulation) or a sharp relief move if shorts are crowded.
Daily pivots: price hovering near resistance
Daily pivot data:
- Pivot point (PP): $0.06
- R1: $0.07
- S1: $0.06
Price at $0.07 sits right on the first resistance (R1). In a bearish regime, trading at R1 without acceptance above it usually marks the upper edge of a short-term supply zone. It is a natural area where late sellers and short-term shorts test the market.
A clean daily close above $0.07 would signal the first small crack in that ceiling. Repeated failures here would reinforce the idea that the trend lower is not finished.
Putting the daily picture together, the main scenario is still bearish. Trend structure is down, moving averages confirm, and the market context is risk-off. However, deeply oversold RSI, flat MACD, and compressed volatility all say the market is in the late innings of this move, not the opening chapter.
Hourly (H1): short-term stabilization, no real bullish control
On the 1H chart, BEAMUSDT trades around $0.07 with a more neutral micro-structure inside the larger bearish trend.
EMAs on H1: flattening out into a range
- Price (close): $0.07
- EMA 20: $0.07
- EMA 50: $0.07
- EMA 200: $0.08
The 20 and 50 EMAs are almost exactly at price, while the 200 EMA hovers above at $0.08. Short term, this says the market has stopped trending and is essentially moving sideways around $0.07.
The 200 EMA overhead acts as a dynamic ceiling for any intraday bounce. So while the daily is decisively bearish, the hourly has cooled into a balance zone, a place where both bulls and bears are probing without clear dominance.
RSI on H1: subdued, not oversold
The 1H RSI is around 38.7.
This is mildly bearish but not oversold, telling us the immediate selling pressure has lightened. After heavy downside, intraday participants are more hesitant to push the tape lower, preferring to wait at better prices. It fits the idea of a digestion phase after a strong move down.
MACD on H1: flatline momentum
On the hourly chart, both MACD line and signal hover around 0, and the histogram is flat.
Intraday momentum has essentially gone to sleep. This is typical for a short-term consolidation, where neither side has conviction. For traders, this environment often punishes overtrading, because there is a lot of noise and little sustained follow-through.
Bollinger Bands & ATR on H1: very tight, breakout potential building
- Bollinger mid: $0.07
- Upper band: $0.07
- Lower band: $0.06
- ATR 14 (H1): ~0
The bands are squeezed and ATR on the 1H is effectively negligible. This is classic volatility compression, meaning the market is coiling, not trending. In this context, the next directional move (up or down) tends to be sharper than usual once price finally escapes this tight range.
Hourly pivots: mid-range equilibrium
- Pivot point (PP): $0.07
- R1: $0.07
- S1: $0.06
Trading right on the pivot indicates the 1H market is in balance. Short-term players are marking $0.07 as fair value, while the lower band and S1 near $0.06 define the immediate downside boundary. This reinforces the picture of consolidation inside a bigger downtrend.
15-minute (M15): execution-only, micro chop near $0.07
The 15-minute chart is not about direction; it is about execution detail. It shows BEAMUSDT chopping right around $0.07.
EMAs on M15: fully flattened
- Price (close): $0.07
- EMA 20: $0.07
- EMA 50: $0.07
- EMA 200: $0.07
All three EMAs are sitting on top of each other. That is the textbook picture of a short-term equilibrium. From an execution standpoint, entries taken in the middle of such a cluster are usually poor.
Better risk/reward typically comes closer to range extremes, not in the dead center.
RSI and MACD on M15: neutral micro-structure
The 15-minute RSI is around 46.5, and the MACD is flat around 0. Short term, neither buyers nor sellers are pressing the tape. This is micro-scale consolidation inside the hourly range and daily downtrend.
Scalpers will find small oscillations, but there is no clear directional edge here by itself.
M15 bands, ATR, and pivots: tight and dull
- Bollinger mid: $0.07
- Upper band: $0.07
- Lower band: $0.06
- ATR 14 (M15): ~0
- Pivot: $0.07, R1 at $0.07, S1 at $0.06
Fifteen-minute volatility is compressed, and pivots are clustered right at price. This usually indicates that any breakout attempt will first show up here as an expansion of the local range.
For execution, traders often wait for 15m closes above the short-term range for breakout confirmation or fade spikes into the extremes if they align with the broader bias.
Market context: macro risk-off weighs on Beam
Right now the dominant force is risk aversion across the crypto complex. Bitcoin dominance near 58% and heavy liquidations signal a defensive backdrop where capital hides in majors and stablecoins while altcoins like Beam are left illiquid and vulnerable.
In that environment, Beam is unlikely to stage a sustainable rally on its own; any bounce will be highly dependent on a broader shift in risk appetite.
Beyond the Beam chart itself, the wider crypto picture is clearly risk-off:
- BTC dominance is around 57.6%, meaning capital prefers Bitcoin and is less willing to sit in small and mid-cap alts.
- Total market cap is flat to slightly up on the day, but with volume down over 30%, indicating fading participation.
- The fear & greed index sits at 17 (Extreme Fear), which is supportive of late-stage selling conditions but usually not where new, aggressive buying steps in.
News flow is also skewed to regulatory, political, and structural concerns rather than growth narratives. That backdrop rarely helps an alt like Beam outperform. Any bullish scenario on BEAMUSDT is fighting not just its own chart, but a nervous macro tape.
Scenarios for Beam crypto (BEAMUSDT)
Bullish scenario: oversold bounce and mean reversion toward $0.10
For the bull case, the story is simple: the downtrend is stretched, sellers are tired, and a basis for a relief rally is forming.
Key ingredients for a bullish play:
- Daily RSI lifts from ~19 toward 30–40, confirming that selling pressure is easing rather than deepening.
- Price holds above the daily pivot at $0.06 and starts printing higher lows on the daily chart.
- H1 EMAs (20 and 50) turn up and start to cross above price, then act as support rather than resistance.
- There is a Bollinger Band expansion upward, with price reclaiming the mid-band near $0.10.
Under that script, the first logical upside checkpoint is the Bollinger mid and daily EMA20 area around $0.09–0.10. That is where mean reversion meets trend resistance. If Beam can accept above $0.10 on strong volume, the conversation shifts from a dead cat bounce to a potential medium-term base.
What would invalidate the bullish scenario?
A decisive daily close back below $0.06, especially if accompanied by an RSI slump that stays sub-20 and a renewed expansion in ATR, would argue that the downside leg has not finished. A hard breakdown through the lower Bollinger Band would also indicate that sellers have found new energy and the bounce thesis is premature.
Bearish scenario: breakdown of the $0.06–0.07 floor, continuation of the trend
The bearish case leans on the structural story: Beam is firmly below all major EMAs, the broader market is in extreme fear, and rallies are likely to be sold until proven otherwise.
Key elements for further downside:
- Daily closes fail above $0.07, confirming R1 as a firm ceiling.
- H1 and M15 break below $0.06 with volume and expanding ATR, showing that the tight range has resolved downward.
- Daily RSI remains stuck in the 15–25 band instead of recovering, signaling persistent, grinding sell pressure.
- MACD rolls lower again with the histogram turning clearly negative, indicating a new momentum push.
In that environment, Beam could enter a slow bleed or a capitulation move, depending on liquidity. Given the already depressed levels, downside targets would need to be drawn from historical support zones or round-number psychology rather than the current data snapshot.
The key takeaway is that the path of least resistance remains lower until the daily structure changes.
What would invalidate the bearish scenario?
If Beam starts to close multiple daily candles above $0.07–0.08 and the 1H 200 EMA at $0.08 flips from resistance to support, the idea of a straightforward trend continuation gets weaker. A sustained push back toward $0.10, with RSI reclaiming neutral territory and MACD crossing positive, would signal that the downtrend is transitioning into a range or early accumulation phase.
How to think about positioning, risk, and uncertainty
Beam crypto is in an awkward but common spot in bear phases: the bigger trend is down, but the easy part of the short trade is probably behind us. Daily indicators show it is oversold and tired, while lower timeframes are coiling in a tight range around $0.07.
For directional traders, the cleaner opportunities tend to be:
- Fading emotional spikes into resistance (around $0.09–0.10) as long as the daily structure stays bearish and EMAs act as a ceiling.
- Or waiting for genuine structural change, with higher lows on the daily, reclaimed moving averages, and RSI back in a healthy range, before committing to a medium-term bullish stance.
Volatility is currently compressed on intraday charts, which means the next expansion could be sharp. In extreme fear environments, both upside squeezes and downside air pockets are common.
Position sizing, clear invalidation levels, and an honest view of time horizon matter more than usual here. Beam is not trading in isolation; it is moving within a defensive, low-conviction crypto market, and that macro tide will heavily influence how any setup plays out.
If you want to monitor markets with professional charting tools and real-time data, you can open an account on Investing using our partner link:
Open your Investing.com account
This section contains a sponsored affiliate link. We may earn a commission at no additional cost to you.
Disclaimer: This article is a market analysis and opinion piece, not investment advice. Cryptoassets are highly volatile and can result in total loss of capital. Always do your own research and consider your financial situation, experience, and risk tolerance before making any trading decisions.
You May Also Like

The Role of Blockchain in Building Safer Web3 Gaming Ecosystems
- Immutable Ownership of Assets Blockchain records can be manipulated by anyone. If a player owns a sword, skin, or plot of land as an NFT, it is verifiably in their ownership, and it cannot be altered or deleted by the developer or even hacked. This has created a proven track record of ownership, providing control back to the players, unlike any centralised gaming platform where assets can be revoked.
- Decentralized Infrastructure Blockchain networks also have a distributed architecture where game data is stored in a worldwide network of nodes, making them much less susceptible to centralised points of failure and attacks. This decentralised approach makes it exponentially more difficult to hijack systems or even shut off the game’s economy.
- Secure Transactions with Cryptography Whether a player buys an NFT or trades their in-game tokens for other items or tokens, the transactions are enforced by cryptographic algorithms, ensuring secure, verifiable, and irreversible transactions and eliminating the risks of double-spending or fraudulent trades.
- Smart Contract Automation Smart contracts automate the enforcement of game rules and players’ economic exchanges for the developer, eliminating the need for intermediaries or middlemen, and trust for the developer. For example, if a player completes a quest that promises a reward, the smart contract will execute and distribute what was promised.
- Anti-Cheating and Fair Gameplay The naturally transparent nature of blockchain makes it extremely simple for anyone to examine a specific instance of gameplay and verify the economic outcomes from that play. Furthermore, multi-player games that enforce smart contracts on things like loot sharing or win sharing can automate and measure trustlessness and avoid cheating, manipulations, and fraud by developers.
- Cross-Platform Security Many Web3 games feature asset interoperability across platforms. This interoperability is made viable by blockchain, which guarantees ownership is maintained whenever assets transition from one game or marketplace to another, thereby offering protection to players who rely on transfers for security against fraud. Key Security Dangers in Web3 Gaming Although blockchain provides sound first principles of security, the Web3 gaming ecosystem is susceptible to threats. Some of the most serious threats include:

Vitalik Buterin Challenges Ethereum’s Layer 2 Paradigm
