

Bitcoin Price Drops to $67K as ETF Outflows Mounts Pressure

Highlights:
- Bitcoin drops to $67K amid growing market uncertainty and heightened selling pressure.
- Spot Bitcoin ETFs face massive outflows, adding pressure to already weak market conditions.
- Bitcoin tests critical support at $69,000, with the risk of further declines if it breaks.
The leading asset, Bitcoin, has declined toward the $67K region as the price continues to correct further under the growing market concerns. The cryptocurrency is hovering around $67,550 after experiencing several weeks of price fluctuations. Analysts point to a combination of bearish macroeconomic signals and a wave of liquidations that have intensified selling pressure in the market.
This crash wiped out the gains that Bitcoin had achieved in January. Bitcoin has lost almost 20% of its value since the start of the year, which has further increased concerns among traders in the market. Liquidations have also soared to over $1 billion within the last 24 hours, as per CoinGlass data.
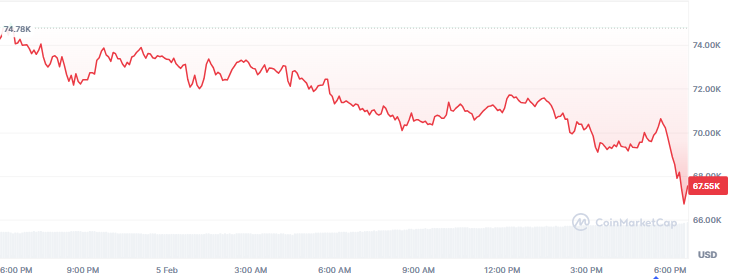 Source: CoinMarketCap
The continued sell-off has seen the total market capitalization plummet by 7% to 2.33 trillion as of this writing. Other cryptocurrencies have not been an exception as well. Ethereum fell by 8%, while XRP suffered a significant decline of 14%. The fear level in the market is currently low at 11, which demonstrates the widespread uncertainty. Bitcoin’s price decline also coincides with the recent remarks from US Treasury Secretary Scott Bessent. He said that his government would not bail out the cryptocurrency.
Bitcoin ETFs Face Major Outflows Amid Market Decline
The sell-off coincides with a withdrawal of funds by investors in spot bitcoin ETFs. Bitcoin ETFs registered outflows of $545 million on Wednesday, extending their losses, as per Sosovalue data. This contributed to the increasing pressure in the digital asset markets, leading to Bitcoin dropping further.
BlackRock’s IBIT recorded the highest outflow with an amount of $373 million. Fidelity’s FBTC and Grayscale’s GBTC were close behind with an outflow of $86 million and $41 million, respectively. Ark & 21Shares, VanEck, and Franklin Templeton also registered withdrawals, adding to the overall downward trend.
Regardless of such outflows, the funds have recorded a high inflow this year, amounting to $3.5 billion. The redemptions have, however, surpassed the inflows, resulting in a negative net position of $1.8 billion. The total assets under management currently amount to $93.5 billion.
According to ETF analyst Eric Balchunas, most investors in Bitcoin ETFs are holding their positions, despite the recent downturn. He estimated that merely 6% of total assets have exited the funds, representing investor confidence even in the face of volatility in the market.
Bitcoin Faces Critical Support Level
Bitcoin is now in a critical support zone, and the current price is testing the $69,000 mark. A major drop may occur if this level fails to hold, according to market analyst CW. The chart also indicates that the price is still in a bearish trend, as the market sentiment continues to shift downwards.
The current support area of around $69,000 is so crucial to the near-term Bitcoin price movement. If it cannot hold, further declines may push the price toward lower levels, triggering another wave of selling pressure.
eToro Platform
Best Crypto Exchange
- Over 90 top cryptos to trade
- Regulated by top-tier entities
- User-friendly trading app
- 30+ million users
eToro is a multi-asset investment platform. The value of your investments may go up or down. Your capital is at risk. Don’t invest unless you’re prepared to lose all the money you invest. This is a high-risk investment, and you should not expect to be protected if something goes wrong.
You May Also Like

Microsoft Corp. $MSFT blue box area offers a buying opportunity

Marathon Digital BTC Transfers Highlight Miner Stress
