

‘Big Short’ Michael Burry Warns Bitcoin May Repeat 2022 Collapse Pattern
Michael Burry, the investor who anticipated the 2008 mortgage crisis, issued a stark warning on February 5 about Bitcoin BTC $66 775 24h volatility: 8.0% Market cap: $1.33 T Vol. 24h: $115.13 B : the cryptocurrency could be replicating the 2021-2022 collapse pattern, which would imply an additional drop toward $50,000 or even lower.
Burry posted on X a comparative chart with the simple message “$BTC Patterns,” where he draws structural similarities between the current drop—from $126,000 to $70,000—and the previous brutal plunge that took Bitcoin from $35,000 to below $20,000.
Although Burry did not specify an exact price target, the visual implication is clear: if the pattern repeats, Bitcoin has room to fall to the $50,000 zone.
Burry’s warning doesn’t come out of nowhere. Just two days earlier, on February 3, he had published an extensive analysis on his Substack detailing why he believes Bitcoin is entering dangerous territory. According to Bloomberg, Burry warned that “sickening scenarios have now come within reach” if Bitcoin fell another 10% from early-week levels.
Burry was specific on something: such a drop would leave Strategy billions in the red with capital markets essentially closed. Beyond that, an additional drop toward $50,000 would not only devastate miners—many operate with tight margins that wouldn’t survive those prices—but would trigger cascading effects that could contaminate other markets.
Technical Analysis Suggests Further Downside
Bitcoin is currently trading at $67,274, down 8.15% in the last 24 hours. Technical indicators show a bearish trend firmly established, with multiple short signals activated across different timeframes. The chart reveals a descending price channel that has been driving the cryptocurrency lower since its all-time high near $126,000.
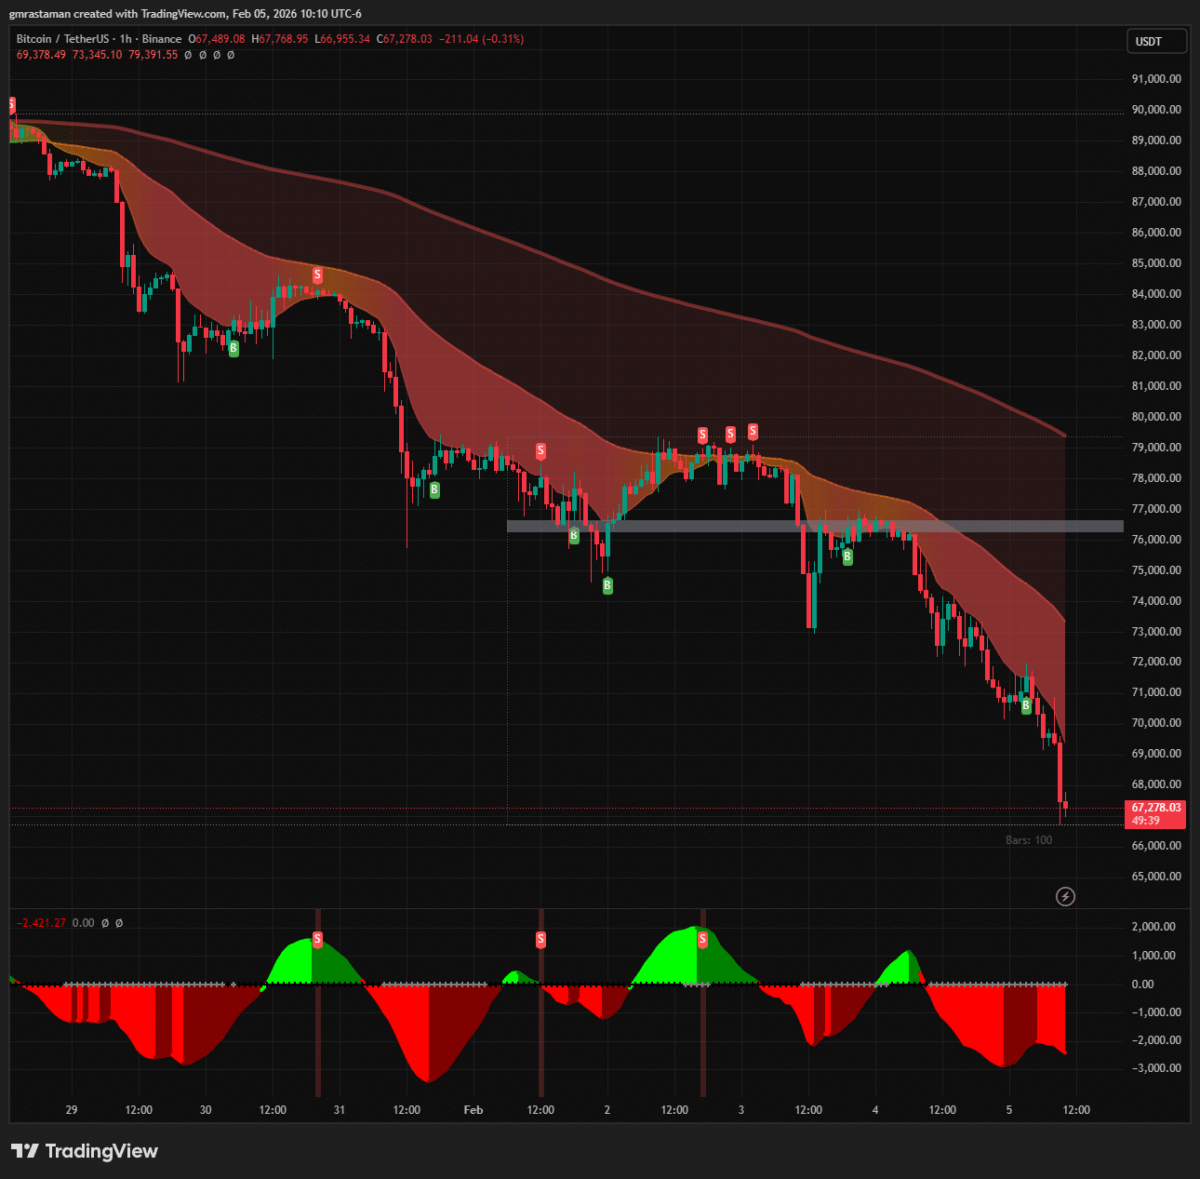
BTC price chart 1H | Source: TradingView
For Bitcoin to reach Burry’s $50,000 target, it would need to fall an additional 25% from current levels. The technical pattern visible on the chart suggests this scenario remains within the realm of possibility, particularly if the descending trend continues.
Short-term indicators including moving averages, momentum oscillators, and volume profiles all point to continued selling pressure, with resistance levels forming around $76,000 that could cap any potential recovery attempts.
Burry’s central thesis is that Bitcoin has been exposed as a purely speculative asset that failed to become a true hedge against monetary debasement. Unlike gold and silver, which have reached all-time highs amid geopolitical tensions and dollar concerns, Bitcoin has completely ignored those traditional catalysts.
Burry dismantles the argument that institutional adoption—through spot ETFs and corporate treasuries—will protect Bitcoin from severe corrections. He points out that approximately 200 public companies hold Bitcoin on their balance sheets, but this doesn’t guarantee stability because “there is nothing permanent about treasury assets.”
The big question dividing analysts is whether this historical pattern has real predictive validity. The 2021-2022 collapse occurred under very different conditions: aggressive Federal Reserve tightening, collapse of unsustainable retail leverage, and the implosion of platforms like Terra and FTX. Today the market has institutional ETFs, greater liquidity depth, and better regulatory infrastructure. But Burry seems to be betting that market psychology and technical patterns can repeat regardless of macro context.
nextThe post ‘Big Short’ Michael Burry Warns Bitcoin May Repeat 2022 Collapse Pattern appeared first on Coinspeaker.
You May Also Like

Microsoft Corp. $MSFT blue box area offers a buying opportunity

Marathon Digital BTC Transfers Highlight Miner Stress
