TLDR Q2 2025 revenue reached HKD5.3 billion, up 7% year over year. Net income rose 113% year over year to HKD2.6 billion. Total trading volume hit HKD3.59 trillion, up 121% year over year. Client assets reached a record HKD974 billion, up 68% year over year. Over 50% of funded accounts came from international clients. Futu [...] The post Futu Holdings Ltd. ($FUTU) Stock: Record Q2 2025 Earnings with Strong Growth appeared first on CoinCentral.TLDR Q2 2025 revenue reached HKD5.3 billion, up 7% year over year. Net income rose 113% year over year to HKD2.6 billion. Total trading volume hit HKD3.59 trillion, up 121% year over year. Client assets reached a record HKD974 billion, up 68% year over year. Over 50% of funded accounts came from international clients. Futu [...] The post Futu Holdings Ltd. ($FUTU) Stock: Record Q2 2025 Earnings with Strong Growth appeared first on CoinCentral.

Futu Holdings Ltd. ($FUTU) Stock: Record Q2 2025 Earnings with Strong Growth

3 min read

TLDR

  • Q2 2025 revenue reached HKD5.3 billion, up 7% year over year.
  • Net income rose 113% year over year to HKD2.6 billion.
  • Total trading volume hit HKD3.59 trillion, up 121% year over year.
  • Client assets reached a record HKD974 billion, up 68% year over year.
  • Over 50% of funded accounts came from international clients.

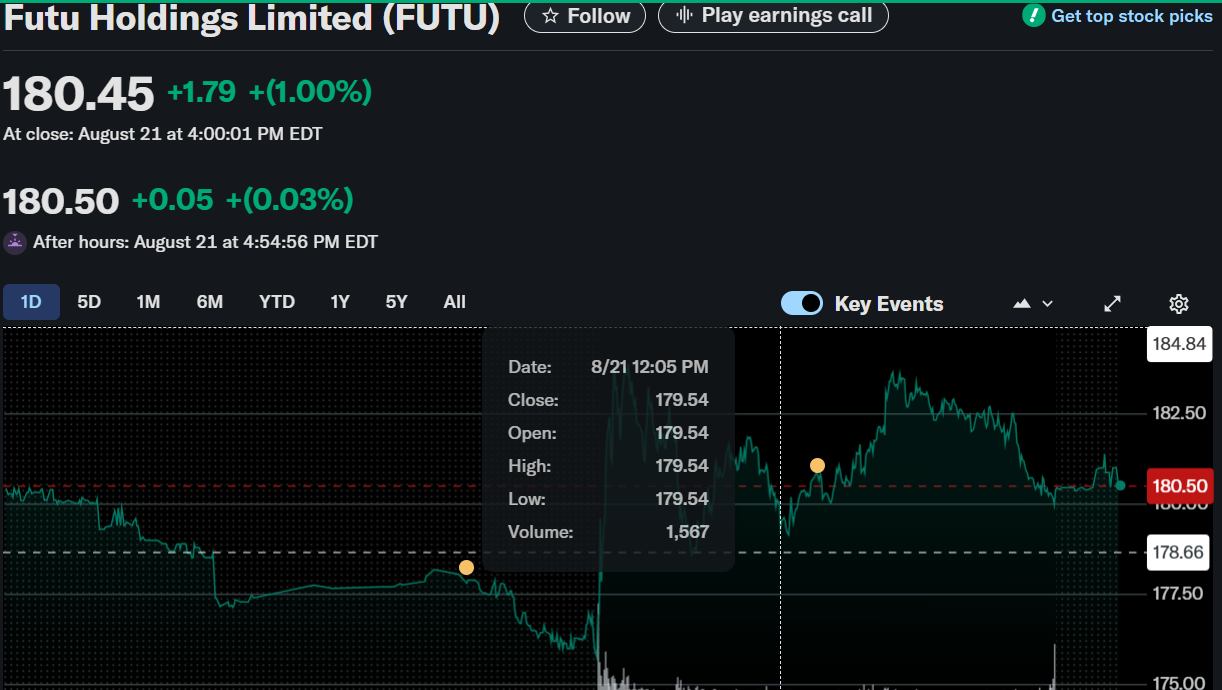
Futu Holdings Ltd. (NASDAQ: FUTU) posted strong second-quarter 2025 earnings on August 20, 2025. The stock traded at $182.67, up 2.24% during market hours, as investors reacted positively to record revenue, income, and client growth.

Futu Holdings Limited (FUTU)

Revenue and Profit Performance

Total revenue came in at HKD5.3 billion, representing a 7% year-over-year increase. Brokerage commission and handling charges contributed HKD2.6 billion, up 87% year over year and 12% from the previous quarter. Interest income rose 44% year over year to HKD2.3 billion, while other income surged 176% year over year to HKD444 million.

Gross profit jumped 82% to HKD4.6 billion, supported by a higher gross margin of 87.4% compared with 81.6% a year earlier. Income from operations rose 126% year over year to HKD3.3 billion, with operating margin strengthening to 63%. Net income surged 113% year over year to HKD2.6 billion, with net margin improving to 48.4%.

Costs and Expenses

Total costs stood at HKD671 million, up 13% year over year. Operating expenses increased to HKD1.3 billion, a 21% rise. Selling and marketing expenses rose 27%, while general and administrative costs grew 17% due to higher headcount. Interest expenses remained flat year over year but dropped 20% sequentially, reflecting cost adjustments.

Trading and Client Growth

Trading activity was robust in Q2. Total trading volume reached HKD3.59 trillion, marking 121% growth year over year and 12% quarter over quarter. Funded accounts rose 41% year over year to 2.9 million. International expansion remained a bright spot, with over half of accounts funded by clients outside of Hong Kong.

Total client assets reached HKD974 billion, a 68% increase year over year and 17% sequentially. Wealth management assets also grew strongly to HKD163.2 billion, more than doubling from last year.

Risks and Challenges

While earnings were strong, risks remain. Hong Kong stock trading volume contracted 9% quarter over quarter, reflecting reduced activity in the technology sector. Customer acquisition showed signs of slowing, partly due to stricter onboarding for Mainland Chinese clients in Hong Kong. Rising selling and marketing costs could also weigh on margins if growth moderates.

Performance Overview

Futu’s stock performance has far outpaced global benchmarks. As of August 21, 2025, year-to-date returns stood at 126.88%, with one-year gains of 213.16%. Over three years, FUTU shares are up 387.33%, while five-year returns reached 485.80%. In comparison, the MSCI World Index gained 11.51% year to date and 72.84% over five years.

Futu’s Q2 earnings confirm its strong position in online brokerage and wealth management. While cost pressures and regional slowdowns present challenges, the company’s international growth and record asset base continue to drive investor optimism.

The post Futu Holdings Ltd. ($FUTU) Stock: Record Q2 2025 Earnings with Strong Growth appeared first on CoinCentral.

Market Opportunity
Oasis Logo
Oasis Price(ROSE)
$0.01555
$0.01555$0.01555
-2.81%
USD
Oasis (ROSE) Live Price Chart
Disclaimer: The articles reposted on this site are sourced from public platforms and are provided for informational purposes only. They do not necessarily reflect the views of MEXC. All rights remain with the original authors. If you believe any content infringes on third-party rights, please contact [email protected] for removal. MEXC makes no guarantees regarding the accuracy, completeness, or timeliness of the content and is not responsible for any actions taken based on the information provided. The content does not constitute financial, legal, or other professional advice, nor should it be considered a recommendation or endorsement by MEXC.

You May Also Like

Top Altcoins To Hold Before 2026 For Maximum ROI – One Is Under $1!

Top Altcoins To Hold Before 2026 For Maximum ROI – One Is Under $1!

BlockchainFX presale surges past $7.5M at $0.024 per token with 500x ROI potential, staking rewards, and BLOCK30 bonus still live — top altcoin to hold before 2026.
Share
Blockchainreporter2025/09/18 01:16
UBS CEO Targets Direct Crypto Access With “Fast Follower” Tokenization Strategy

UBS CEO Targets Direct Crypto Access With “Fast Follower” Tokenization Strategy

The tension in UBS’s latest strategy update is not between profit and innovation, but between speed and control. On February 4, 2026, as the bank reported a record
Share
Ethnews2026/02/05 04:56
Cryptos Signal Divergence Ahead of Fed Rate Decision

Cryptos Signal Divergence Ahead of Fed Rate Decision

The post Cryptos Signal Divergence Ahead of Fed Rate Decision appeared on BitcoinEthereumNews.com. Crypto assets send conflicting signals ahead of the Federal Reserve’s September rate decision. On-chain data reveals a clear decrease in Bitcoin and Ethereum flowing into centralized exchanges, but a sharp increase in altcoin inflows. The findings come from a Tuesday report by CryptoQuant, an on-chain data platform. The firm’s data shows a stark divergence in coin volume, which has been observed in movements onto centralized exchanges over the past few weeks. Bitcoin and Ethereum Inflows Drop to Multi-Month Lows Sponsored Sponsored Bitcoin has seen a dramatic drop in exchange inflows, with the 7-day moving average plummeting to 25,000 BTC, its lowest level in over a year. The average deposit per transaction has fallen to 0.57 BTC as of September. This suggests that smaller retail investors, rather than large-scale whales, are responsible for the recent cash-outs. Ethereum is showing a similar trend, with its daily exchange inflows decreasing to a two-month low. CryptoQuant reported that the 7-day moving average for ETH deposits on exchanges is around 783,000 ETH, the lowest in two months. Other Altcoins See Renewed Selling Pressure In contrast, other altcoin deposit activity on exchanges has surged. The number of altcoin deposit transactions on centralized exchanges was quite steady in May and June of this year, maintaining a 7-day moving average of about 20,000 to 30,000. Recently, however, that figure has jumped to 55,000 transactions. Altcoins: Exchange Inflow Transaction Count. Source: CryptoQuant CryptoQuant projects that altcoins, given their increased inflow activity, could face relatively higher selling pressure compared to BTC and ETH. Meanwhile, the balance of stablecoins on exchanges—a key indicator of potential buying pressure—has increased significantly. The report notes that the exchange USDT balance, around $273 million in April, grew to $379 million by August 31, marking a new yearly high. CryptoQuant interprets this surge as a reflection of…
Share
BitcoinEthereumNews2025/09/18 01:01