Ethereum Price under pressure as oversold daily chart clashes with vulnerable intraday bounces

While crypto markets remain defensive, the Ethereum price is attempting a short-term rebound inside a broader downtrend that still dominates the bigger picture.
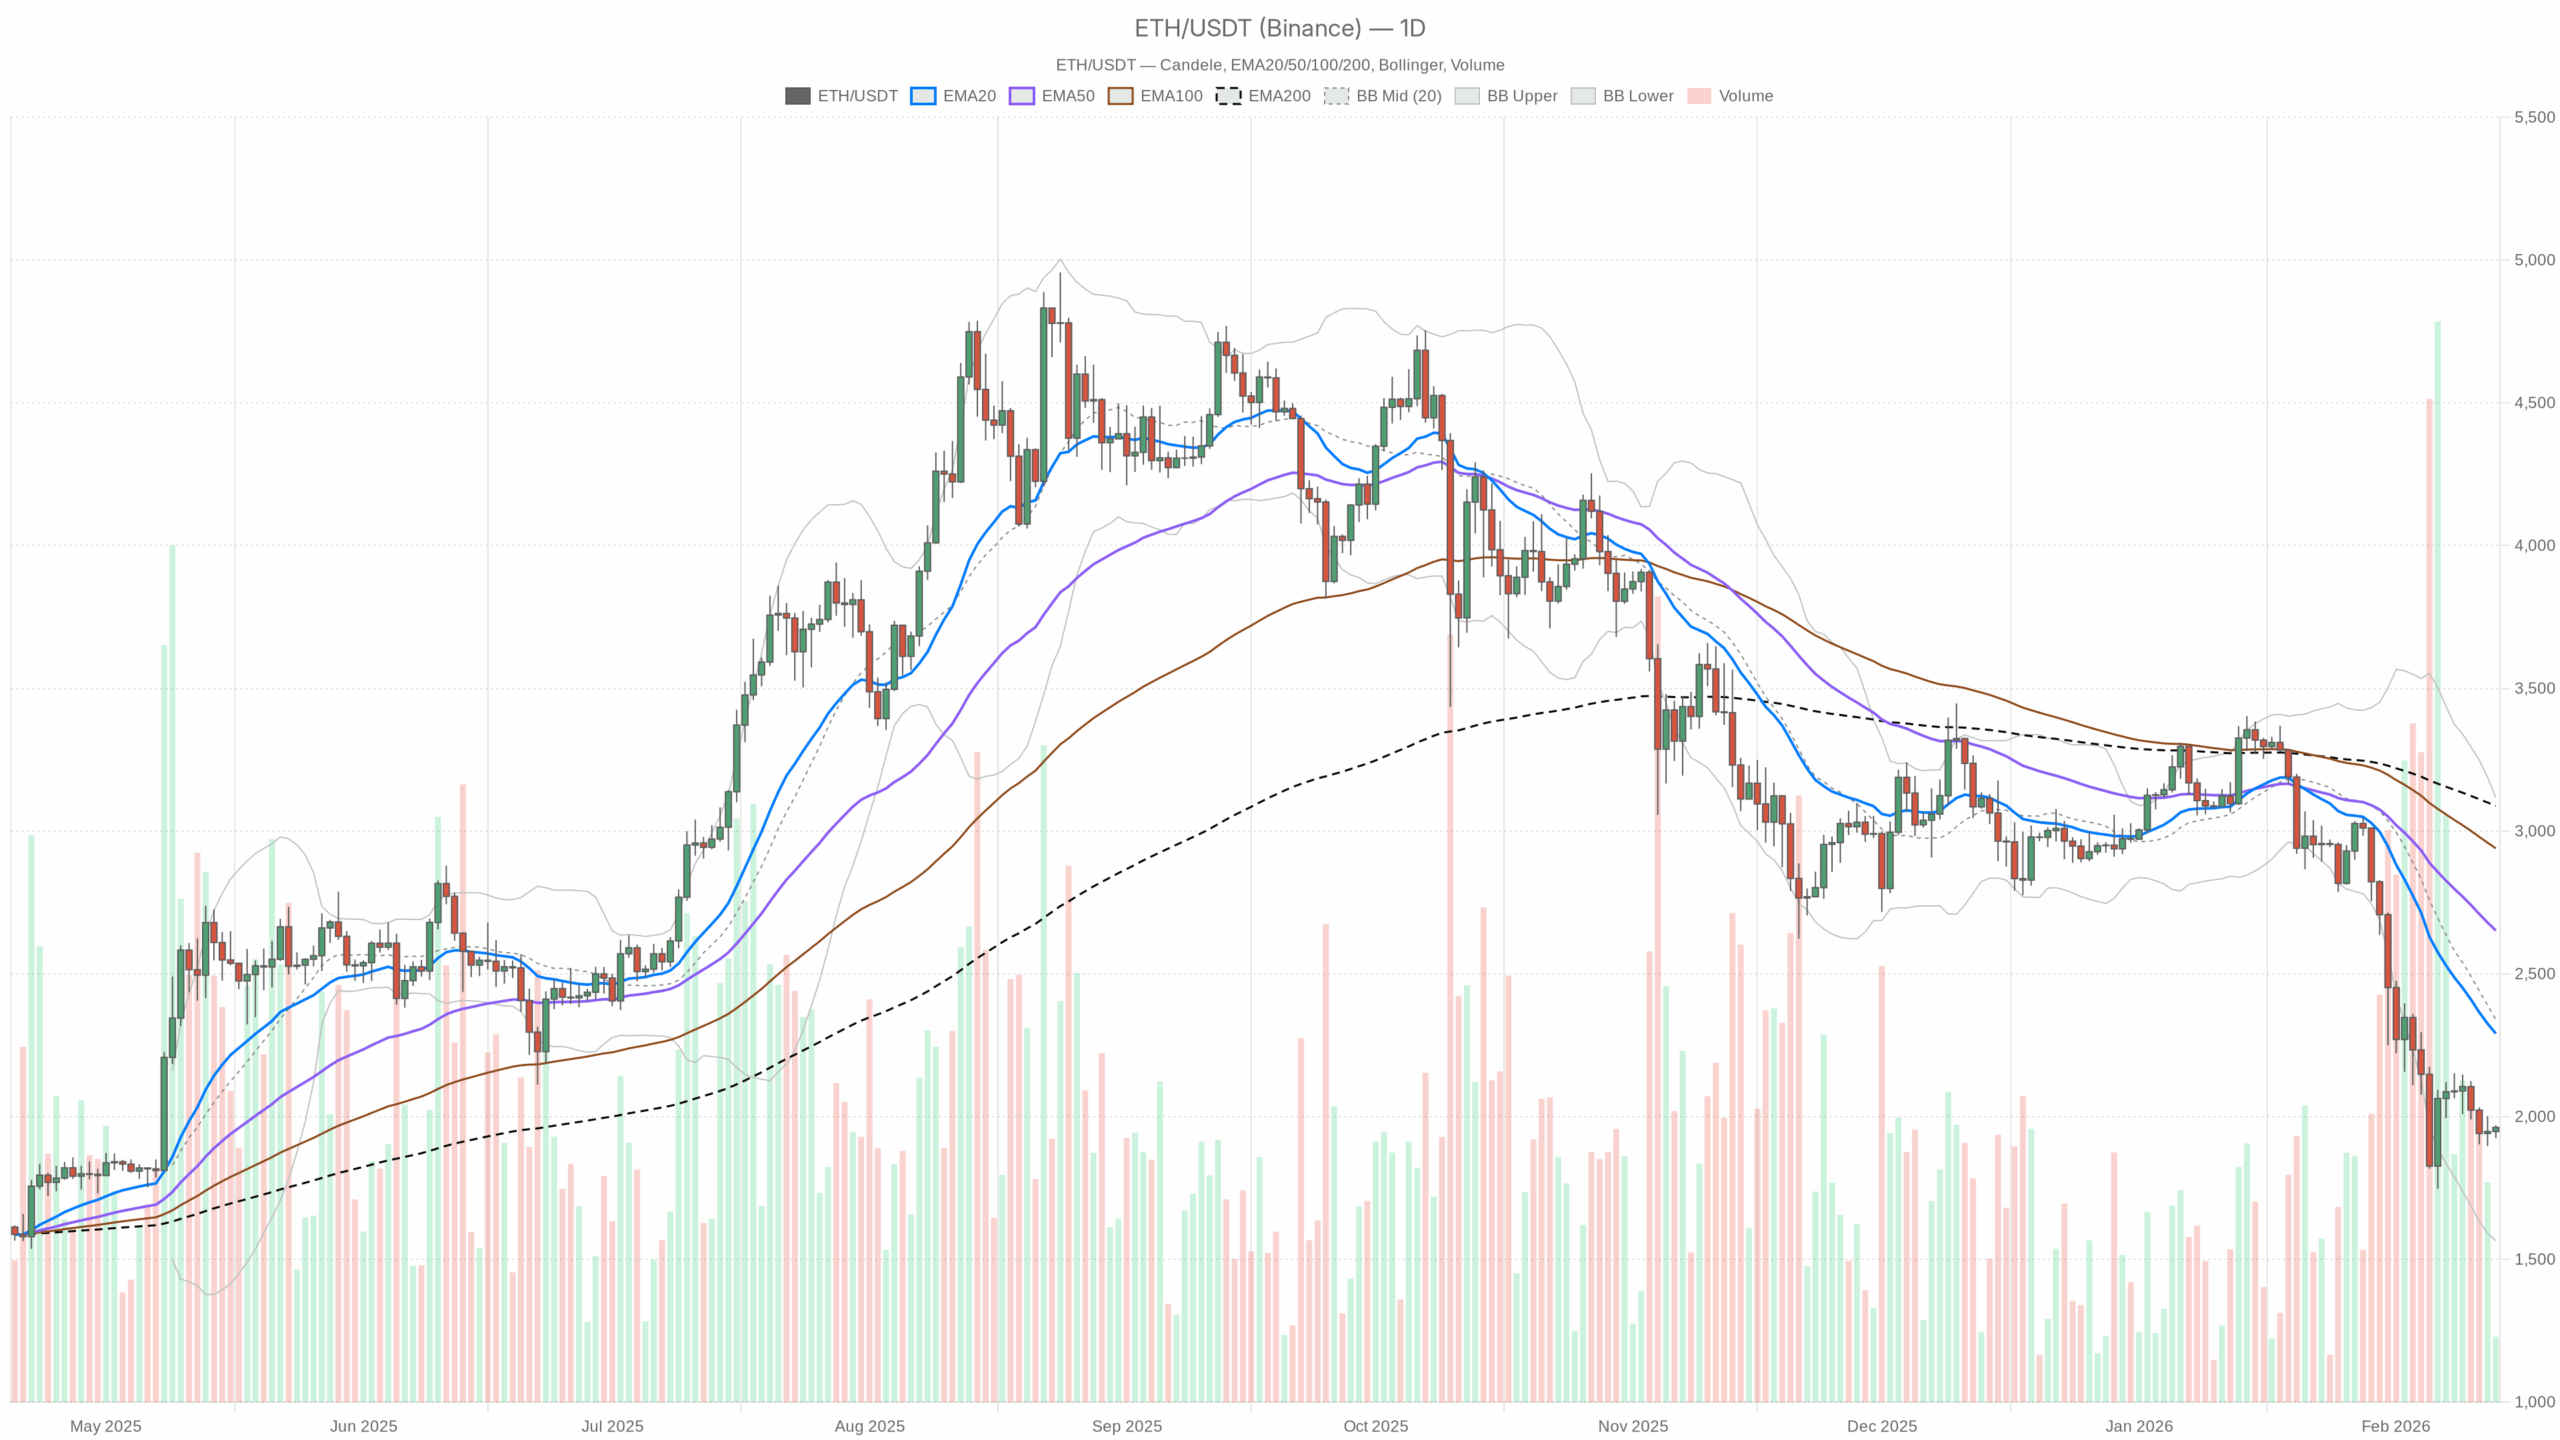 ETH/USDT daily chart with EMA20, EMA50 and volume”
loading=”lazy” />ETH/USDT — daily chart with candlesticks, EMA20/EMA50 and volume.
Market Thesis: Heavy Daily Downtrend vs Intraday Relief
Ethereum price against USDT is trading around $1,960, deep inside a mature downtrend. The key point right now: the daily structure is clearly bearish, but short-term timeframes are trying to stage a rebound. This is classic bear-market action — violent countertrend bounces inside a broader down-leg.
This moment matters because the daily chart is now oversold while macro crypto sentiment is at Extreme Fear (9) and BTC dominance is high at about 56.6%. In other words, the market is defensive, capital is hiding in Bitcoin and stablecoins, and Ethereum is being de-risked. The big question: does this oversold backdrop trigger a tradable mean-reversion rally, or is it just a pause before another leg lower?
Daily Timeframe (D1): Dominant Bias is Bearish
On the daily chart, the bias is unambiguously bearish. Trend, momentum, and volatility all line up to show a market that has been under steady selling pressure, now approaching exhaustion but not yet showing a proper trend reversal.
EMAs (Trend Structure)
Daily price is at $1,962, well below all key moving averages:
- EMA 20: $2,291.05
- EMA 50: $2,651.67
- EMA 200: $3,088.74
All three EMAs are stacked bearishly above price, with a wide gap from the 200-day. This is a mature downtrend where rallies have plenty of overhead resistance. It tells you the path of least resistance is still down, and any bounce into the 20-day EMA would be a test of the sellers resolve rather than proof of a new bull leg.
RSI (Momentum)
RSI 14 (Daily): 29.62
Daily RSI has slipped below 30, which means the move is now technically oversold. This aligns with how washed-out the chart looks. In practical terms, it often precedes a bounce or consolidation. However, in a strong downtrend oversold can stay oversold longer than people expect. So the bears are in control, but they are getting extended.
MACD (Trend Momentum)
MACD Line: -269.62 | Signal: -254.44 | Histogram: -15.18
The MACD line is below the signal, deep in negative territory, with a small negative histogram. The trend downside momentum is still there, but the histogram being relatively modest suggests the selling impulse may be slowing rather than accelerating. That fits with the idea of a tired downtrend, not a fresh breakdown.
Bollinger Bands (Volatility & Positioning)
Middle Band (20 SMA proxy): $2,340.59 | Upper: $3,116.33 | Lower: $1,564.84
Price is trading below the middle band and relatively closer to the lower band, well under the midline at $2,340. The bands themselves are wide, reflecting elevated volatility. Being on the lower half of the bands confirms a pressure zone where sellers have dominated. However, the distance to the lower band also means the immediate crash risk is slightly less acute than if price were pinned to the band.
ATR (Volatility)
ATR 14 (Daily): $206.86
Daily ATR above $200 on a roughly $2,000 asset is sizeable. Swings of around 10% in either direction are on the table in short order. This is not a quiet grind; it is a high-volatility downtrend where both squeezes and flushes can be violent. Position sizing matters here more than usual.
Daily Pivot Levels (Reference Levels)
Daily pivot levels are:
- Pivot Point (PP): $1,952.04
- R1: $1,979.36
- S1: $1,934.82
Ethereum is hovering almost exactly at the daily pivot around $1,952–$1,962. Trading near the pivot after a selloff often indicates a short-term pause or an area where intraday traders are fighting for control. A push and hold above R1 would signal intraday buyers taking the upper hand. A decisive move under S1 would show the downtrend reasserting itself.
1-Hour Chart (H1): Short-Term Relief Rally Inside a Bearish Context
The 1-hour timeframe is trying to stabilize after the dump. The system flags the regime as neutral, which makes sense: we are seeing a short-term bounce but nothing structurally bullish yet.
EMAs (Intraday Trend)
On H1:
- Price: $1,960.64
- EMA 20: $1,947.95 (price slightly above)
- EMA 50: $1,960.17 (price right on it)
- EMA 200: $2,046.70 (well above)
Price reclaiming and hovering around the 20- and 50-hour EMAs is a sign of a short-term stabilization or relief rally. However, the 200-hour EMA remains far overhead near $2,047, marking the boundary of the larger downtrend on this timeframe. Intraday bulls have room to push higher without touching the higher-timeframe downtrend line in the sand.
RSI (Intraday Momentum)
RSI 14 (H1): 54.64
Hourly RSI is slightly above neutral, reflecting modest bullish momentum after the prior drop. This looks more like a countertrend bounce than an aggressive new buying cycle. Momentum is improving, but not euphoric.
MACD (Intraday Momentum Shift)
MACD Line: -0.90 | Signal: -4.59 | Histogram: 3.69
The MACD line is below zero but has crossed above the signal with a positive histogram. That is a classic short-term bullish cross inside a broader bearish field. Sellers are backing off, and short-term traders are trying to pick the lows. Nevertheless, as long as MACD stays below zero, the bounce is still technically against the dominant trend.
Bollinger Bands (H1 Positioning)
Middle Band: $1,937.70 | Upper: $1,969.48 | Lower: $1,905.92
Price is near the upper band at around $1,960–$1,969. That shows the bounce has pushed Ethereum to the top of its recent intraday range. Often, hugging the upper band on the 1-hour can lead to either a continuation grind higher or a fade back to the mean. In a bearish higher-timeframe regime, these upper-band tags tend to be selling opportunities for swing traders.
ATR & Pivot (H1 Micro-Range)
ATR 14 (H1): $16.64
An intraday ATR of around $16 suggests typical 1-hour bars have meaningful range but are manageable compared to the daily swings. For traders, that is enough volatility for opportunity without being totally chaotic.
Hourly pivot levels are:
- PP: $1,962.20
- R1: $1,967.70
- S1: $1,955.14
Price is basically sitting on the hourly pivot and just under R1. Holding above $1,955 and breaking cleanly above $1,968 would cement the intraday bounce. Losing $1,955 and then $1,945–$1,935 opens the door for another downside rotation.
15-Minute Chart (M15): Execution Context
The 15-minute chart is there for timing, not for macro bias. It currently shows a more energetic push higher, in line with the H1 bounce.
EMAs (Micro-Structure)
On M15:
- Price: $1,960.65
- EMA 20: $1,951.29
- EMA 50: $1,946.58
- EMA 200: $1,956.66
Price is above all three EMAs, and the shorter EMAs are tilting upward. This is a short-term uptrend inside the broader intraday and daily downtrend. For scalpers and day traders, dips toward the 15-minute 20 EMA are currently being defended. However, this can flip quickly if the higher-timeframe selling resumes.
RSI & MACD (Short-Term Momentum)
RSI 14 (M15): 61.27
RSI on the 15-minute is above 60, reflecting healthy short-term buying pressure. It is not yet at a blow-off level, but you are firmly in bounce mode rather than bottom-fishing.
MACD Line: 5.20 | Signal: 3.59 | Histogram: 1.61
The MACD on M15 is positive and above its signal with a green histogram — momentum is plainly up in the very short term. This is the timeframe where the bounce looks the strongest, which is precisely why it is dangerous to extrapolate it without respecting the daily downtrend.
Bollinger Bands & Pivot (M15)
Middle Band: $1,946.82 | Upper: $1,969.61 | Lower: $1,924.03
Price is near the upper band again, mirroring the H1 picture. Short-term buyers have pushed ETH to the top of its micro-range. That is often where late longs chase and more patient players start trimming or fading.
15-minute pivot levels:
- PP: $1,960.17
- R1: $1,963.64
- S1: $1,957.18
With price sitting on the 15-minute pivot, micro-structure is finely balanced. A pop through $1,964 could extend toward the Bollinger upper band zone. A break back below $1,957 would hint that the micro-bounce is losing steam.
Broader Market & Sentiment Context
The wider crypto backdrop is not friendly to Ethereum right now:
- BTC dominance: ~56.6% — capital is crowding into Bitcoin, not ETH.
- Total market cap 24h change: -1.31% — broad risk-off tone.
- Fear & Greed Index: 9 (Extreme Fear) — risk appetite is extremely low.
Recent news headlines talk about crypto gloom, ETF outflows from Bitcoin and Ether, and risk-off behavior. That lines up cleanly with what the charts are saying: this is a defensive environment where rallies are being sold, not chased.
Scenarios for Ethereum Price
Main Scenario (Based on D1): Bearish with Oversold Risk of Sharp Bounces
The dominant scenario remains bearish as defined by the daily chart: price well below all major EMAs, negative MACD, and an oversold RSI. The key nuance: we are in the late stage of this down-leg, where sharp countertrend rallies become more likely, but, by default, they are still rallies to sell rather than a new uptrend.
Bullish Scenario
For the bullish case, Ethereum needs to turn this oversold backdrop into a sustained mean-reversion move:
- Step 1: Hold above the daily pivot (around $1,952) and build a base above $1,930–1,940. Losing that band cleanly keeps control in bearish hands.
- Step 2: Use the intraday strength (H1 and M15 up-momentum) to break and hold above the short-term resistance cluster around $1,980–2,000 (near intraday R1s and upper Bollinger areas).
- Step 3: Extend toward the daily 20 EMA around $2,290. That is the first serious test of whether sellers are willing to reload. A strong push toward this level with RSI climbing back toward 45–50 on the daily would mark a genuine corrective rally.
What invalidates the bullish scenario?
If ETH fails to hold above roughly $1,930, and especially if it closes a daily candle well below the daily pivot and S1, the notion of a sustained bounce weakens. A fresh breakdown with daily RSI staying stuck below 30 would show that the market is not ready to mean-revert yet.
Bearish Scenario
The bearish path assumes this intraday bounce is a classic dead-cat rally inside a strong downtrend:
- Ethereum price struggles to hold above $1,960–1,980 and fails to reclaim the $2,000 handle with conviction.
- Intraday indicators (H1 and M15 RSI/MACD) roll over from their current mildly overbought levels while daily RSI stays oversold, pointing to another leg lower.
- Price breaks below $1,930–1,940 support and drives toward the lower daily Bollinger region, with room down toward the mid-$1,600s if selling accelerates again.
What invalidates the bearish scenario?
A decisive reclaim of the $2,050–2,100 area, where the H1 200 EMA currently sits, would be the first serious red flag for bears. If price can push above that zone and daily RSI recovers above 40 with MACD downside momentum fading further, the argument for a simple continuation down becomes much weaker. The real structural win for bulls would be a sustained reclaim of the daily 20 EMA near $2,290; until that happens, the bearish thesis remains structurally intact.
Positioning, Risk, and Uncertainty
Across timeframes, the message is clear: daily is bearish and oversold, while intraday is trying to bounce. That tension is where traders usually get chopped up. They may chase short-term green candles into a bigger downtrend, or short into the hole right before a squeeze.
In an environment with elevated daily ATR, extreme fear sentiment, negative news flow, and ETH sitting well below its key EMAs, position sizing and timeframe discipline matter more than directional conviction. Short-term traders might work with the M15 and H1 uptrend for tactical longs, but they are trading against the daily bias and need to be quick. Swing traders leaning with the daily bear trend will often look to fade strength into resistance zones rather than sell every low.
Nothing on this chart rules out a brutal short squeeze higher or a further capitulation leg lower; both fit inside the current volatility regime. The only thing the market is clearly saying is that we are in a defensive phase for Ethereum, and any exposure should be sized with the understanding that the Ethereum price can move hundreds of dollars in very little time.
You May Also Like

WLFI Expands Into Forex With World Swap Launch

Usdt stablecoin could challenge Bitcoin leadership