What’s Next for ETH Price as Ethereum Foundation Starts the Staking of 70,000 ETH
Key Insights:
- Ethereum price is just below $1,800 as charts continue to focus on $1,735 and $1,600.
- Ethereum Foundation started staking treasury, depositing 2,016 ETH and aiming to reach around 70,000 ETH.
- Analysts see weak bids, so ETH price could test monthly lows before any rebound.
Ethereum price is struggling around $1,800 after a sharp plunge in February. Traders are watching to see if the market can defend nearby support as volatility remains high. At the same time, the Ethereum Foundation has begun staking part of its treasury, adding a fresh fundamental narrative to a still-cautious tape.
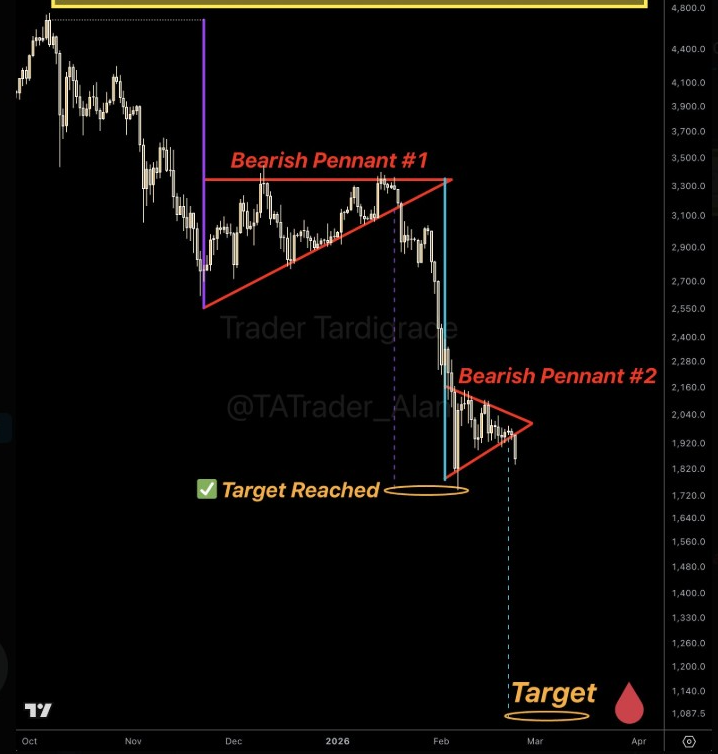
Ethereum Price Bearish Pennant Breakdown Keeps $1,735 in Focus
Trader Tardigrade pointed out a second bearish pennant on the Ethereum price chart on the daily timeframe. He said that the structure has broken down and is reminiscent of a previous continuation setup. In his view, the recent consolidation is viewed as a pause within a larger downtrend.
 ETH Bearish Pennant | Source: Tardigrade, X
The first pennant move, he noted, already hit a measured target of about $1,735. That level is now an immediate checkpoint again, particularly as traders look for liquidity pockets and stop clusters. If Ethereum price tests $1,735 again, the reaction there could determine whether or not sellers are still in charge.
Even if a bounce can be obtained, the pennant’s framework is cautionary that rebounds can happen very quickly. Sellers tend to defend lower highs following breakdowns, keeping pressure on price. Therefore, ETH must recover broken trendlines and old support zones before the bearish signal loses strength.
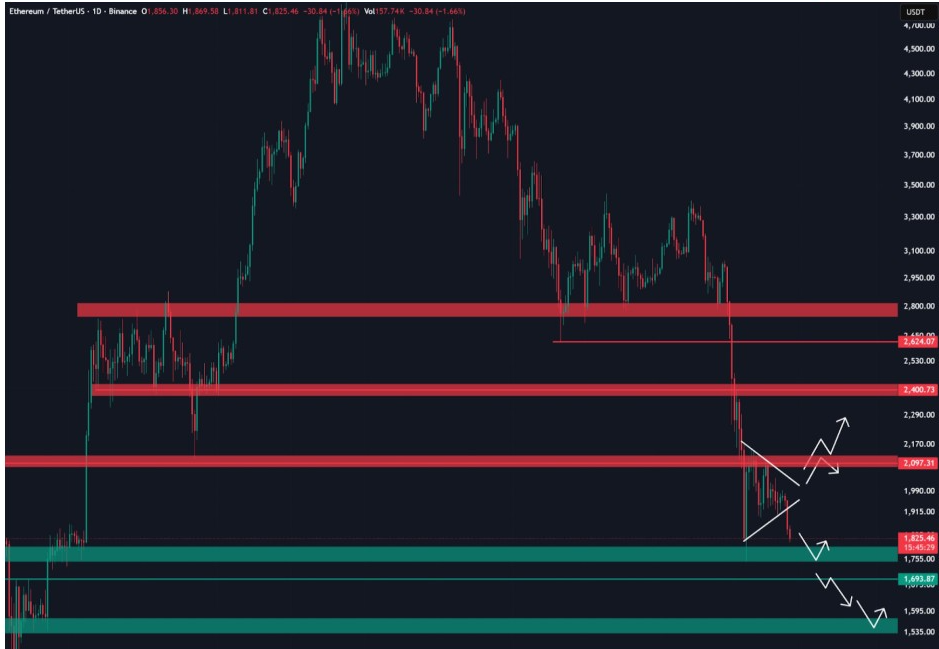
Buyers are Hesitant Near $1,800 as Foundation Begins Staking
Meanwhile, Ethereum price has drifted toward $1,800 without attracting strong bids, TedPillows said. He expects a sweep of the month’s lows before a durable rebound forms. That view is based on weak demand following repeated breakdowns and shallow consolidations.
 ETHUSDT Daily Chart | Source: Ted, X
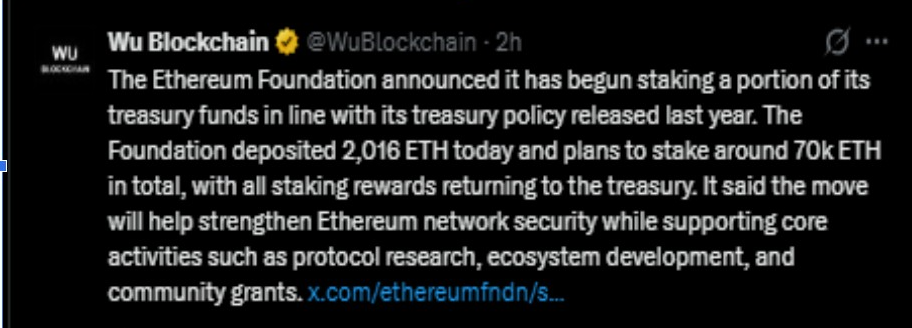
Alongside the debate over the chart, the Ethereum Foundation confirmed it has begun to stake a portion of the treasury. Staking started with a 2016 ETH deposit and aims to achieve about 70,000 ETH over time. The foundation attributed the decision to its treasury policy and preference for having ETH put to productive use, rather than idle.
 Ethereum Foundation Staking | Source: Wu Blockchain, X
The staking setup utilizes Dirk and Vouch, open-source validator tools developed by Attestant. Dirk is a distributed signer to eliminate single points of failure and enable coordination across jurisdictions. Vouch is responsible for validator operations. The foundation said staking rewards will be fed back into protocol research, ecosystem development, and community grants.
Still, the added yield is not enough to ensure near-term price support. Arkham data show the foundation has some 172,650 ETH available to deploy, plus 10,000 WETH. That supply context keeps traders cautious, even as staking adds a constructive longer-term signal.
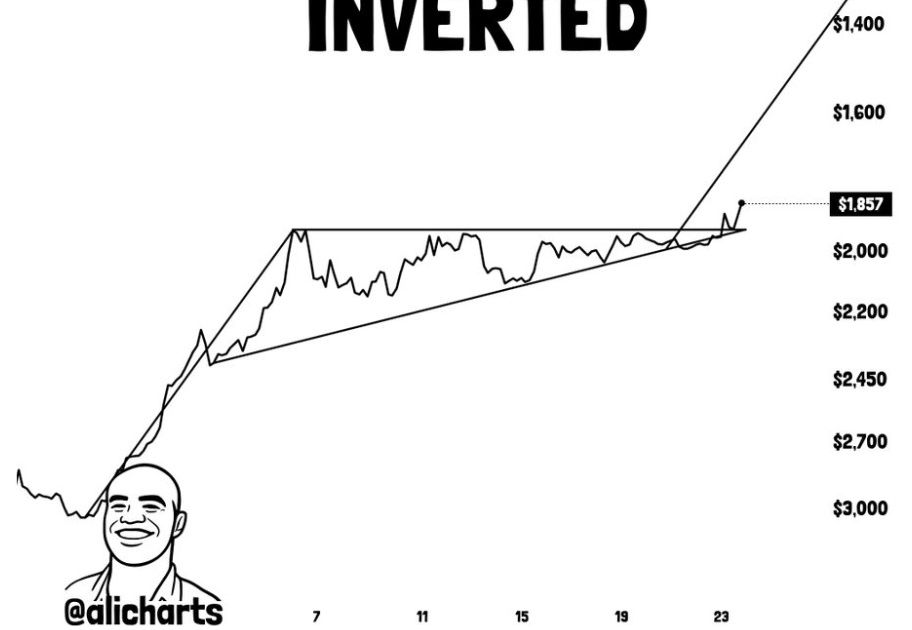
A “Breakout” Signal Flips Bearish as the Chart is Inverted
Ali Charts suggested what appears to be a bullish flag breakout on the four-hour view. However, he emphasized that the chart is upside down, which reverses the conclusion. In practical terms, the apparent breakout can mean additional downside risk on a normal chart.
 ETH 4-H Chart Inverted | Source: Ali, X
The inverted projection featured areas that fall to $1,600 as an important target. It also charted lower checkpoints near $1,400 and $1,260 if selling accelerates. The signal can be confusing to traders, leading to even more risk of false moves in choppy sessions.
This caution is appropriate for the current market environment. Liquidity remains thin, and forced flows can amplify small moves. Ethereum’s price, as a major altcoin, tends to go on a wild ride when stops are triggered across the derivatives books.
Downside Targets Emerge if ETH Loses its Range Floor
Importantly, Greeny zoomed into a larger range zone that has been driving Ethereum price action for months. He said failure to hold that range floor could open targets near $1,390 and even $880. Those levels suggest a deeper unwind if the sellers regain full control.
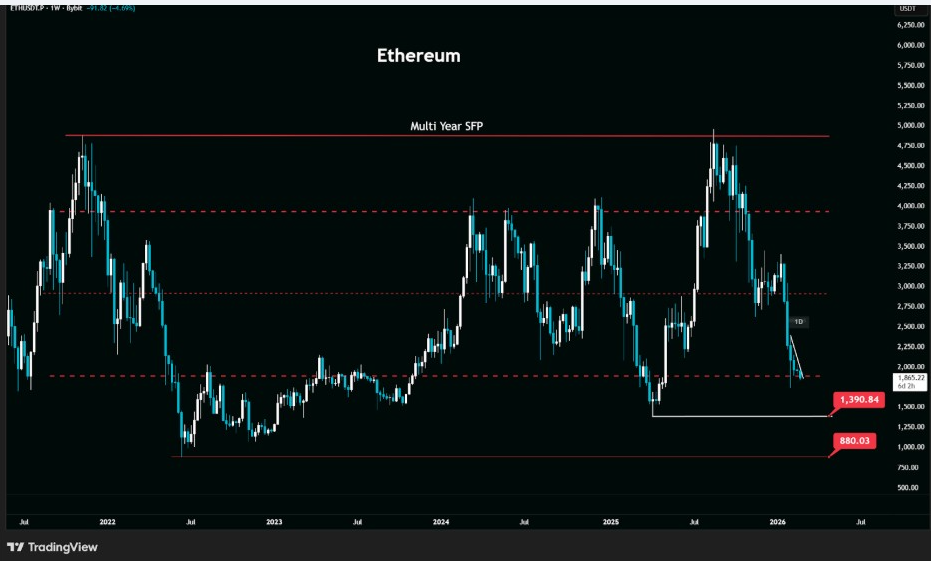 ETHUSD Weekly Chart | Source: Greeny, X
The map also points to interim supports that could slow the move. A firm defense near $1,735 or $1,600 may still lead to stabilization of the structure and invite short covering. However, the longer-range view leaves risk levels defined should the market break again.
The post What’s Next for ETH Price as Ethereum Foundation Starts the Staking of 70,000 ETH appeared first on The Market Periodical.
You May Also Like

ROKFORM Launches Rugged Case and Screen Protectors for Samsung Galaxy S26

Academic Publishing and Fairness: A Game-Theoretic Model of Peer-Review Bias