$250 to $83: Is This Solana’s Generational Buy Zone?
- SOL traded near $83 after falling about 77% from its all-time high, with $80 acting as key support.
- The two-week chart placed SOL near 0.618 Fib support, while $75 to $45 remained the posted accumulation zone.
- Binance and OKX long-short ratios stayed above 3, while 4-hour SOL long liquidations topped $1.04 million.
Solana traded near $83 after a deep pullback from much higher levels. The move brought fresh attention to price support and trader positioning.
A market post also framed the current zone as a possible long-term entry area. For now, traders are watching whether SOL can hold support and regain momentum.
Solana Drop From $250 Sparks Fresh Debate
Solana traded near $83 after falling well below the $250 area. That decline brought fresh attention to market calls made near previous highs. A widely shared post questioned why many bullish voices had gone quiet.
The post said some traders promoted SOL above $250 during peak optimism. It added that those same voices were now silent with prices below $80. That message spread quickly across crypto trading circles.
The post framed the current move as a reset after heavy speculation. It described the earlier rally as a period of strong fear of missing out. At the same time, it presented the current zone as a possible opportunity.
Two-Week Chart Puts Focus on Fib Support and Accumulation Zone
The post pointed to Solana’s two-week chart for its main setup. It said SOL had dropped about 77% from its all-time high. It also placed price near the 0.618 Fibonacci support zone.
That support area often draws attention from long-term traders and swing traders. In this case, the post marked an accumulation zone between $75 and $45. Those levels now sit below the current market price.
The same post listed $500 and $1,000 as long-term targets. It also said, “I’ll add more if it goes lower.” Those targets remain unconfirmed, and the chart still needs stronger price support.
Momentum Signals Stay Soft on the Daily Chart
The 14-day RSI stood near 40.83 on the shared chart. Its average was near 51.00, which kept momentum below neutral. That reading showed buyers still lacked firm control.
At the same time, RSI was not in deeply oversold territory. That meant the market still had room to move either way. For now, the indicator matched the weak and choppy price action.
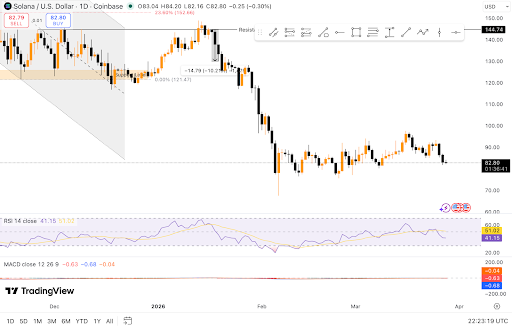 Solana nears $80 support as weak momentum keeps traders cautious. Source: TradingView.
MACD also stayed slightly negative on the daily timeframe. The MACD line was near -0.65, while the signal line was near -0.70. The histogram remained weak, which suggested upside strength was still limited.
Derivatives Data and Market Calls Add More Context
Exchange data showed a clear long bias among Solana traders. Binance SOL/USDT accounts had a 3.3215 long-short ratio. OKX SOL accounts showed a similar ratio near 3.23.
Binance top trader accounts showed a 3.4484 ratio, while top trader positions stood at 1.1271. That gap suggested many accounts leaned long. However, larger positions appeared more balanced than account counts suggested.
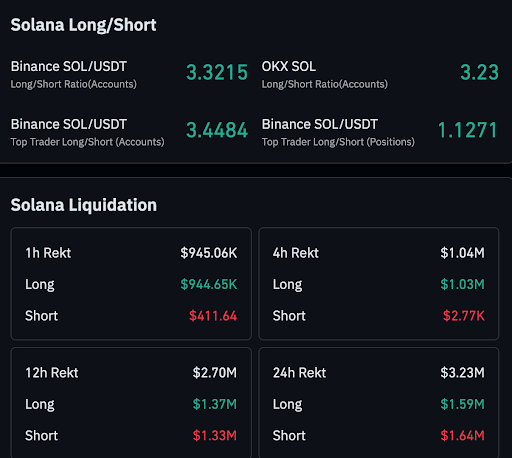 Solana longs dominate while liquidations rise. Source: CoinGlass market data.
Liquidation data showed recent pressure on long traders. One-hour liquidations reached about $945,060, and almost all were longs. Four-hour liquidations topped $1.04 million, and long positions made up nearly all of that amount.
A market post added another angle to the discussion. It described the $75 to $45 area as an accumulation zone and said, “bullish at $250” voices were now quiet. The same post listed $500 and $1,000 targets, though the chart has not confirmed them.
The post $250 to $83: Is This Solana’s Generational Buy Zone? appeared first on Live Bitcoin News.
You May Also Like

XRP Whale Accumulation Hits 30-Day High: Could Ripple (XRP) Be Gearing Up for a Breakout?
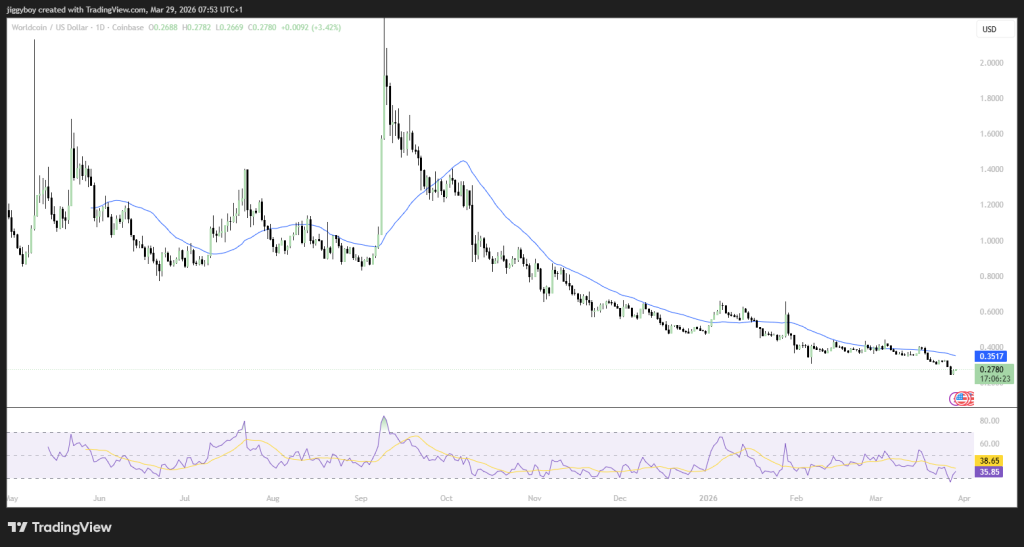
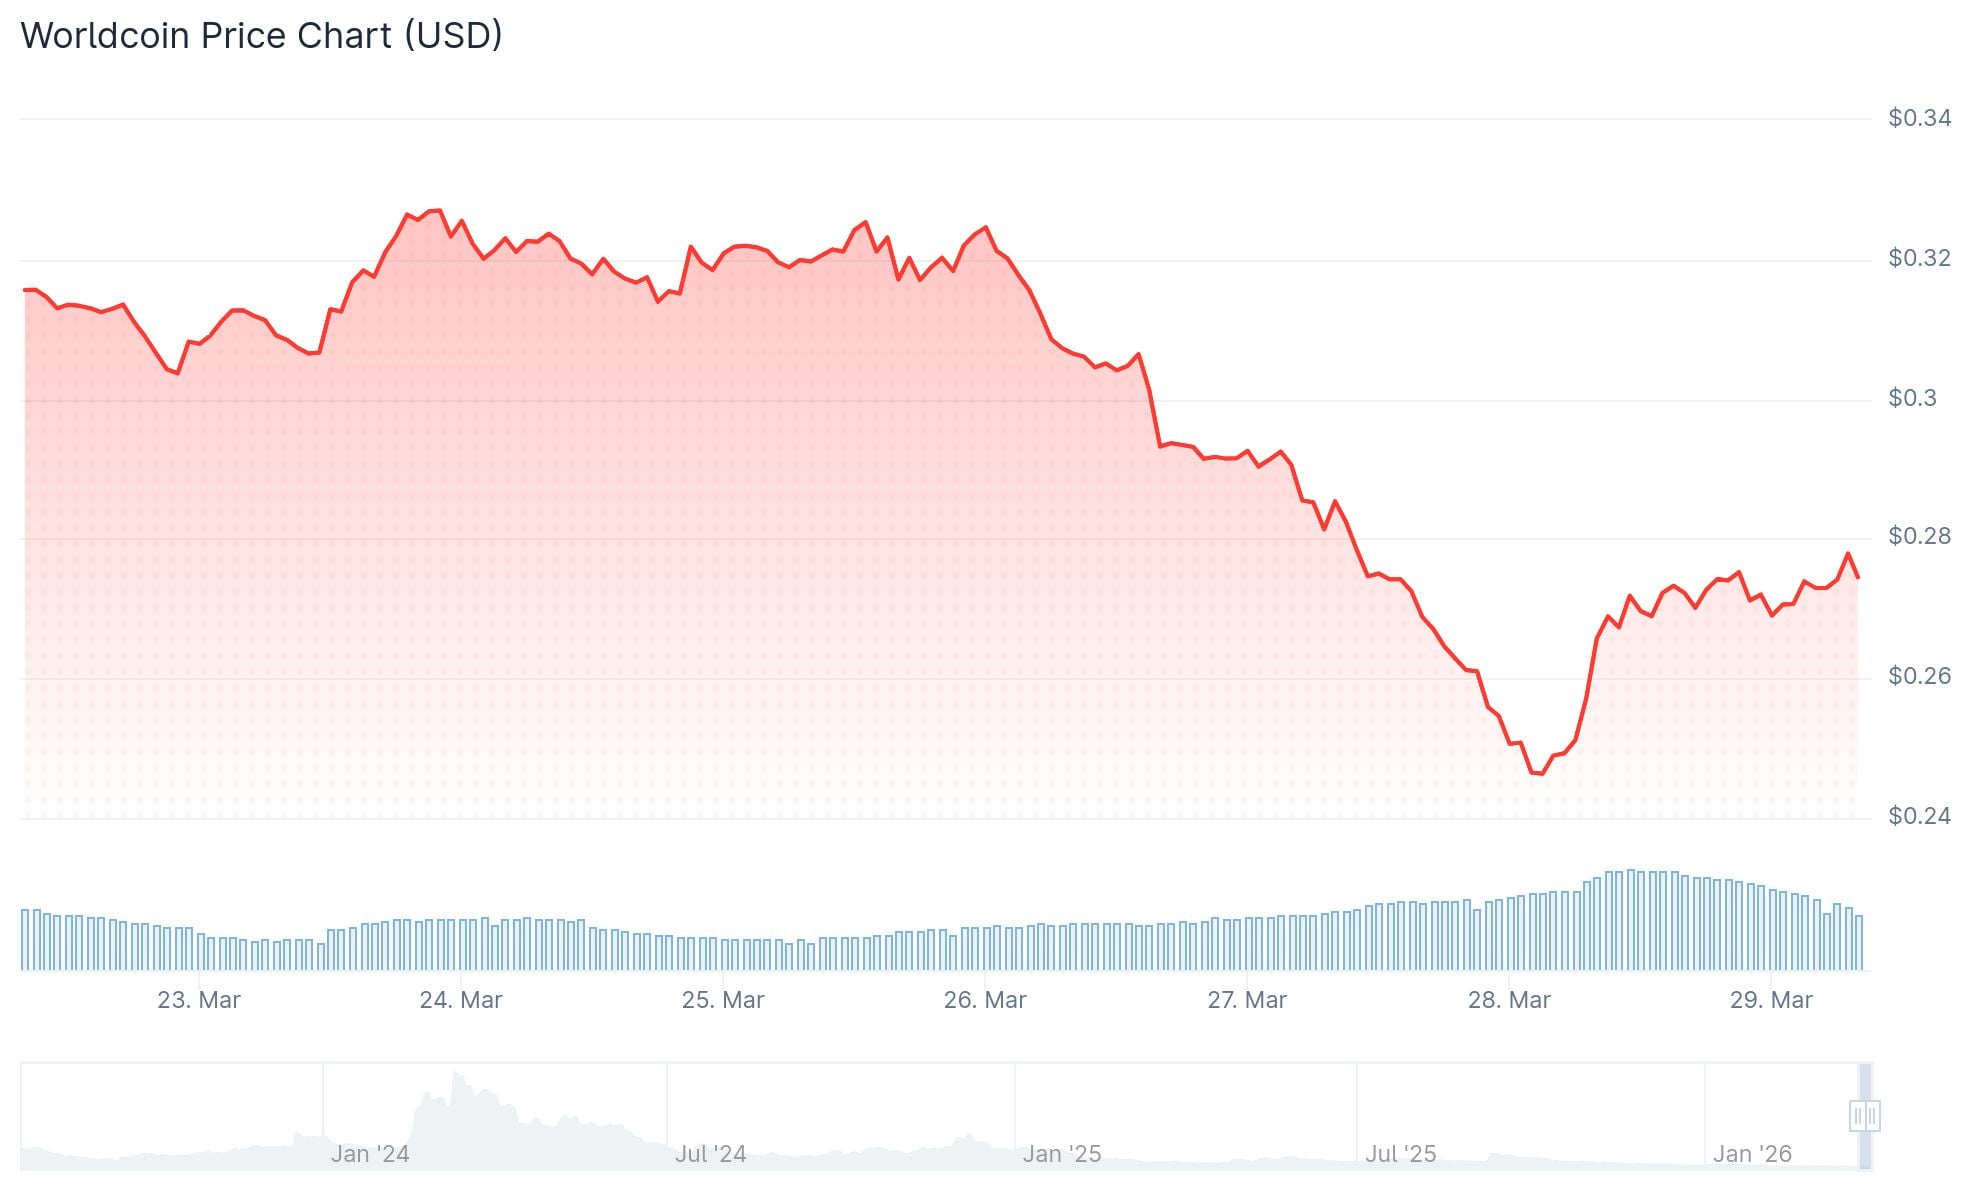
Crypto Price Prediction for Today, March 29: Worldcoin (WLD), XRP, Pi Coin