

Solana (SOL) Price: Analyst Sees $45–$75 Buy Zone as ETF Outflows Hit Fourth-Largest on Record
TLDR
- Solana rose over 2% on Monday after four straight days of losses totaling a 5% drop last week.
- US spot Solana ETFs recorded $7.84 million in outflows on Friday, the fourth-largest single-day outflow on record.
- Over $22.98 million in SOL derivatives were liquidated in 24 hours, with long positions accounting for $19.18 million of that.
- The funding rate turned negative at -0.0141%, meaning traders are paying a premium to hold short positions.
- Key support sits around $70–$75, with analysts watching for a potential drop toward $50 if that level breaks.
Solana is trying to recover after a rough week, but the data behind the price tells a cautious story. ETF outflows, heavy liquidations, and bearish derivatives positioning all suggest the bounce may be short-lived.
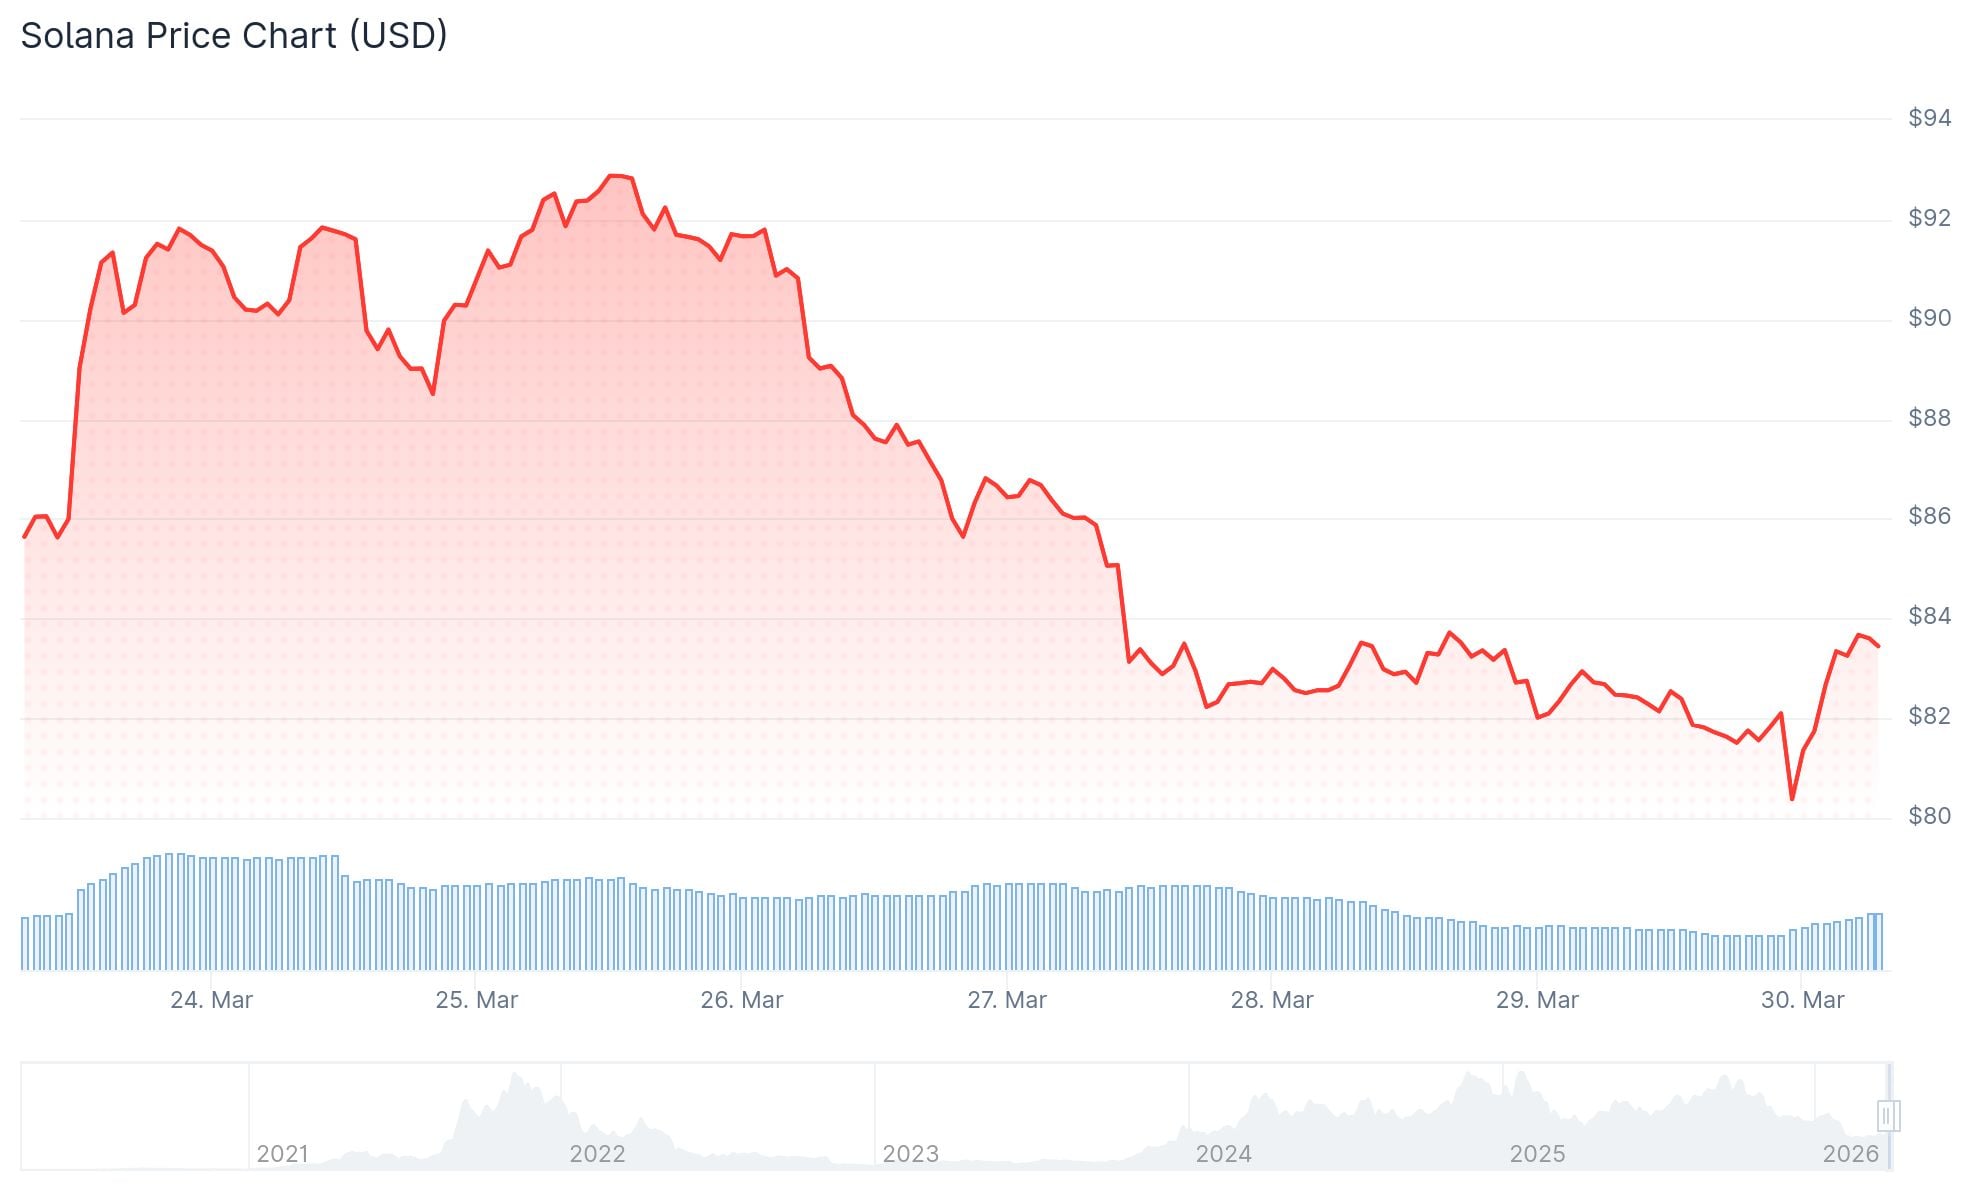 Solana (SOL) Price
Solana ended last week down about 5%, touching lows just above $81 before gaining over 2% on Monday. The price had broken below a rising support trendline near $88, which many technical traders viewed as a turning point.
The 50-, 100-, and 200-day Exponential Moving Averages (EMAs) are all sitting above the current price, adding to the bearish picture. SOL would need to close above $91 on a daily basis to start shifting that outlook.
The MACD indicator has crossed below its signal line and moved into negative territory. The RSI sits at 42, below the neutral 50 level, which suggests sellers still have the upper hand.
US spot Solana ETFs recorded $7.84 million in net outflows on Friday alone. That was the fourth-largest single-day outflow since those products launched, and it marked the third consecutive week of net negative flows.
 Source: SoSoValue
If institutional outflows continue through this week, it would add more downside pressure to an already fragile price structure.
On the derivatives side, $22.98 million in SOL positions were liquidated in the past 24 hours. The bulk of that — $19.18 million — came from long positions being wiped out.
The negative funding rate of -0.0141% shows traders are willing to pay a premium to stay short, which is a direct read on bearish market sentiment.
Analysts Eye $70–$75 as the Key Zone
Analyst Crypto Patel posted a two-week chart showing SOL has dropped roughly 77% from its all-time high near $250. His chart places a key support and entry zone between $45 and $75, with a Fibonacci retracement level at $52.11 serving as a deeper target.
Patel noted that bullish sentiment was loud when Solana traded above $250, but is now quiet with the price below $80. He views current weakness as a potential accumulation phase for long-term holders, with targets of $500 and $1,000 over a longer time horizon.
A separate analysis from More Crypto Online used a one-hour chart to show Solana had broken below a short-term upward trendline. That analyst labeled the move as a possible “wave 3” lower, pointing toward a support zone between $71.91 and $77.91.
What the Charts Say Now
Immediate support sits at the recent low of $81.44. A break below that opens the door to $75.63, the low from February 24 that started the prior rising trend.
Resistance overhead is clustered between $84.85 and $87.71, with the 50-day EMA at $91.24 acting as a larger hurdle.
SOL ETF flows are being watched closely, with Friday’s $7.84 million outflow the clearest sign yet of institutional hesitation.
The post Solana (SOL) Price: Analyst Sees $45–$75 Buy Zone as ETF Outflows Hit Fourth-Largest on Record appeared first on CoinCentral.
You May Also Like

Metaplanet raises $1.4B to fuel BTC purchases and U.S. subsidiary launch

Zurich U.S. Extend 30-Year Collaboration with Insurity, Advancing Cloud-based Policy Administration and Bureau Managed Services


