Author: Michael Nadeau Compiled by: Plain Language Blockchain The post-pandemic era has been defined by fiscal dominance—an economy driven by government deficits and short-term Treasury bond issuance, with liquidity remaining high even as the Federal Reserve maintains high interest rates. Today, we are entering a phase dominated by the private sector, where the Treasury is withdrawing liquidity through tariffs and spending restrictions, unlike the previous administration. That's why interest rates need to fall. We analyze the current cycle from the perspective of global liquidity to emphasize why the current round of "devaluation trading" has reached its final stage. Is fiscal dominance coming to an end? We always hope to "buy the dip" when everyone else is "chasing the rise". That's why all the recent discussions about "devaluation trading" have caught our attention. Data: Google Trends We believe the interest in "devaluation trading" arose a few years ago. At that time, Bitcoin was priced at $25,000 and gold at $2,000. Back then, nobody talked about it except cryptocurrency and macro analysts. In our view, this "deal" is essentially complete. Therefore, our task is to understand the conditions that created it, and whether those conditions will continue to exist. What drove this deal? In our view, there are mainly two factors. 1. Treasury spending. During the Biden administration, we implemented a large-scale fiscal deficit. Data: US Treasury The fiscal year 2025 has just ended, and the deficit has narrowed slightly—primarily due to increased taxes (tariffs) rather than reduced spending. However, the Big Beautiful Bill is expected to achieve spending cuts by reducing benefits from Medicaid and the Supplemental Nutrition Assistance Program (SNAP). Data: Comparison of KFF (Kaiser Family Foundation) cuts with current spending trajectory During Biden's presidency, government spending and transfer payments continuously injected liquidity into the economy. However, under the Great America Act, spending growth slowed. This means that the government is injecting less money into the economy. In addition, the government is withdrawing funds from the economy through tariffs. Data: FRED (St. Louis Federal Reserve Economic Data) The combination of spending restrictions (relative to the previous administration) and increased tariffs means that the Treasury is now absorbing liquidity rather than supplying it. This is why we need to cut interest rates. "We will privatize the economy, revitalize the private sector, and shrink the government." - Scott Bessent 2. "Treasury QE". To fund the excessive spending by the Treasury during the Biden administration, we also saw a new form of "quantitative easing" (QE). We can observe this below (black line). "Treasury QE" supported the market by funding government spending through short-term notes rather than long-term bonds. Data: Global Liquidity Index We believe that fiscal spending and quantitative easing by the Treasury have fueled the “devaluation trade” and “everything bubble” that we have seen in the past few years. But now we are transitioning to a "Trump economy," with the private sector taking over the reins from the Treasury. Similarly, this is why they need to lower interest rates. They need to use bank loans to stimulate the private sector. As we enter this transition period, the global liquidity cycle appears to be peaking... The global liquidity cycle is peaking and declining. Current cycle and average cycle Below, we can observe a comparison between the current cycle (red line) and the historical average cycle (gray line) since 1970. Data: Global Liquidity Index Asset allocation Based on Mr. Howell's work on global liquidity indices, we can observe typical liquidity cycles and their alignment with asset allocation. Commodities are often the last assets to fall, which is exactly what we are seeing today (gold, silver, copper, palladium). From this perspective, the current cycle looks very typical. Data: Global Liquidity Index So, if liquidity is indeed peaking, we expect investors to rotate into cash and bonds as the environment changes. To be clear, this process hasn't even begun yet (the market remains "risk-averse"). Debt and Liquidity According to the Global Liquidity Index, the debt-to-liquidity ratio of major economies reached its lowest level since 1980 at the end of last year. It is now rising and is expected to continue rising until 2026. Data: Global Liquidity Index The rising debt-to-liquidity ratio makes it more difficult to service trillions of dollars of outstanding debt that need to be refinanced. Data: Global Liquidity Index Bitcoin and Global Liquidity Of course, Bitcoin has "foreshadowed" peak global liquidity in the past two cycles. In other words, Bitcoin peaked months before liquidity peaked and began to decline, seemingly anticipating the subsequent drop. Data: Global Liquidity Index We don't know if this is happening right now. But we do know that cryptocurrency cycles always closely follow liquidity cycles. Alignment with the cryptocurrency cycle Data: Global Liquidity IndexAuthor: Michael Nadeau Compiled by: Plain Language Blockchain The post-pandemic era has been defined by fiscal dominance—an economy driven by government deficits and short-term Treasury bond issuance, with liquidity remaining high even as the Federal Reserve maintains high interest rates. Today, we are entering a phase dominated by the private sector, where the Treasury is withdrawing liquidity through tariffs and spending restrictions, unlike the previous administration. That's why interest rates need to fall. We analyze the current cycle from the perspective of global liquidity to emphasize why the current round of "devaluation trading" has reached its final stage. Is fiscal dominance coming to an end? We always hope to "buy the dip" when everyone else is "chasing the rise". That's why all the recent discussions about "devaluation trading" have caught our attention. Data: Google Trends We believe the interest in "devaluation trading" arose a few years ago. At that time, Bitcoin was priced at $25,000 and gold at $2,000. Back then, nobody talked about it except cryptocurrency and macro analysts. In our view, this "deal" is essentially complete. Therefore, our task is to understand the conditions that created it, and whether those conditions will continue to exist. What drove this deal? In our view, there are mainly two factors. 1. Treasury spending. During the Biden administration, we implemented a large-scale fiscal deficit. Data: US Treasury The fiscal year 2025 has just ended, and the deficit has narrowed slightly—primarily due to increased taxes (tariffs) rather than reduced spending. However, the Big Beautiful Bill is expected to achieve spending cuts by reducing benefits from Medicaid and the Supplemental Nutrition Assistance Program (SNAP). Data: Comparison of KFF (Kaiser Family Foundation) cuts with current spending trajectory During Biden's presidency, government spending and transfer payments continuously injected liquidity into the economy. However, under the Great America Act, spending growth slowed. This means that the government is injecting less money into the economy. In addition, the government is withdrawing funds from the economy through tariffs. Data: FRED (St. Louis Federal Reserve Economic Data) The combination of spending restrictions (relative to the previous administration) and increased tariffs means that the Treasury is now absorbing liquidity rather than supplying it. This is why we need to cut interest rates. "We will privatize the economy, revitalize the private sector, and shrink the government." - Scott Bessent 2. "Treasury QE". To fund the excessive spending by the Treasury during the Biden administration, we also saw a new form of "quantitative easing" (QE). We can observe this below (black line). "Treasury QE" supported the market by funding government spending through short-term notes rather than long-term bonds. Data: Global Liquidity Index We believe that fiscal spending and quantitative easing by the Treasury have fueled the “devaluation trade” and “everything bubble” that we have seen in the past few years. But now we are transitioning to a "Trump economy," with the private sector taking over the reins from the Treasury. Similarly, this is why they need to lower interest rates. They need to use bank loans to stimulate the private sector. As we enter this transition period, the global liquidity cycle appears to be peaking... The global liquidity cycle is peaking and declining. Current cycle and average cycle Below, we can observe a comparison between the current cycle (red line) and the historical average cycle (gray line) since 1970. Data: Global Liquidity Index Asset allocation Based on Mr. Howell's work on global liquidity indices, we can observe typical liquidity cycles and their alignment with asset allocation. Commodities are often the last assets to fall, which is exactly what we are seeing today (gold, silver, copper, palladium). From this perspective, the current cycle looks very typical. Data: Global Liquidity Index So, if liquidity is indeed peaking, we expect investors to rotate into cash and bonds as the environment changes. To be clear, this process hasn't even begun yet (the market remains "risk-averse"). Debt and Liquidity According to the Global Liquidity Index, the debt-to-liquidity ratio of major economies reached its lowest level since 1980 at the end of last year. It is now rising and is expected to continue rising until 2026. Data: Global Liquidity Index The rising debt-to-liquidity ratio makes it more difficult to service trillions of dollars of outstanding debt that need to be refinanced. Data: Global Liquidity Index Bitcoin and Global Liquidity Of course, Bitcoin has "foreshadowed" peak global liquidity in the past two cycles. In other words, Bitcoin peaked months before liquidity peaked and began to decline, seemingly anticipating the subsequent drop. Data: Global Liquidity Index We don't know if this is happening right now. But we do know that cryptocurrency cycles always closely follow liquidity cycles. Alignment with the cryptocurrency cycle Data: Global Liquidity Index
Is the global liquidity cycle peaking? Is the Bitcoin bull market over?

2025/11/05 07:00

Author: Michael Nadeau

Compiled by: Plain Language Blockchain

The post-pandemic era has been defined by fiscal dominance—an economy driven by government deficits and short-term Treasury bond issuance, with liquidity remaining high even as the Federal Reserve maintains high interest rates.

Today, we are entering a phase dominated by the private sector, where the Treasury is withdrawing liquidity through tariffs and spending restrictions, unlike the previous administration.

That's why interest rates need to fall.

We analyze the current cycle from the perspective of global liquidity to emphasize why the current round of "devaluation trading" has reached its final stage.

Is fiscal dominance coming to an end?

We always hope to "buy the dip" when everyone else is "chasing the rise".

That's why all the recent discussions about "devaluation trading" have caught our attention.

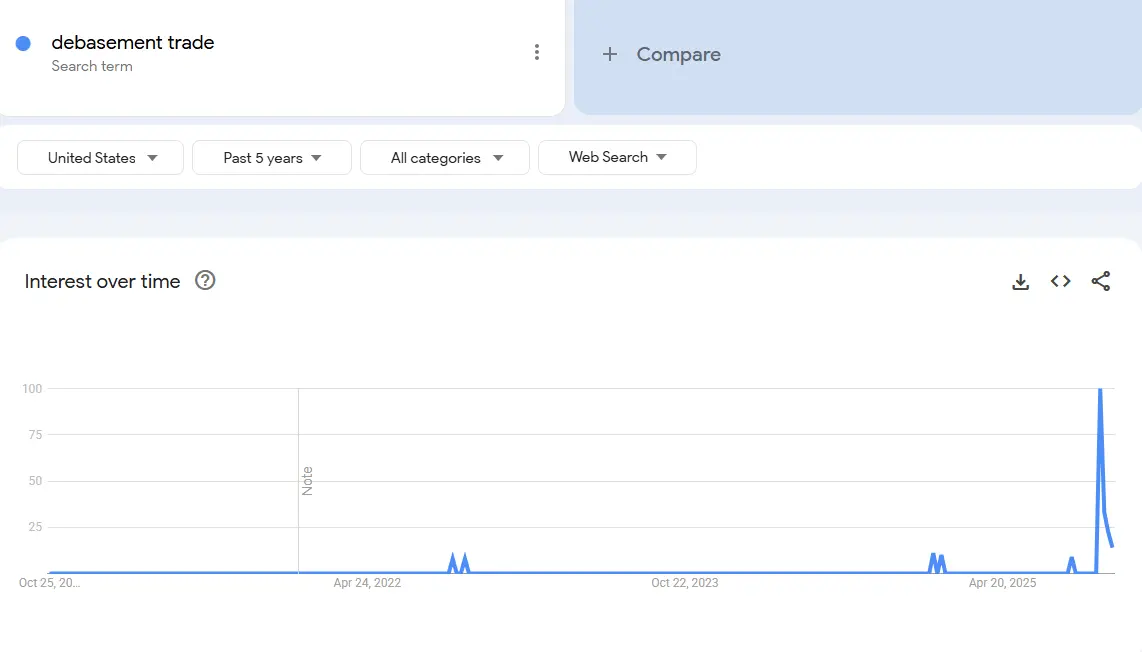
Data: Google Trends

We believe the interest in "devaluation trading" arose a few years ago. At that time, Bitcoin was priced at $25,000 and gold at $2,000. Back then, nobody talked about it except cryptocurrency and macro analysts.

In our view, this "deal" is essentially complete.

Therefore, our task is to understand the conditions that created it, and whether those conditions will continue to exist.

What drove this deal? In our view, there are mainly two factors.

1. Treasury spending. During the Biden administration, we implemented a large-scale fiscal deficit.
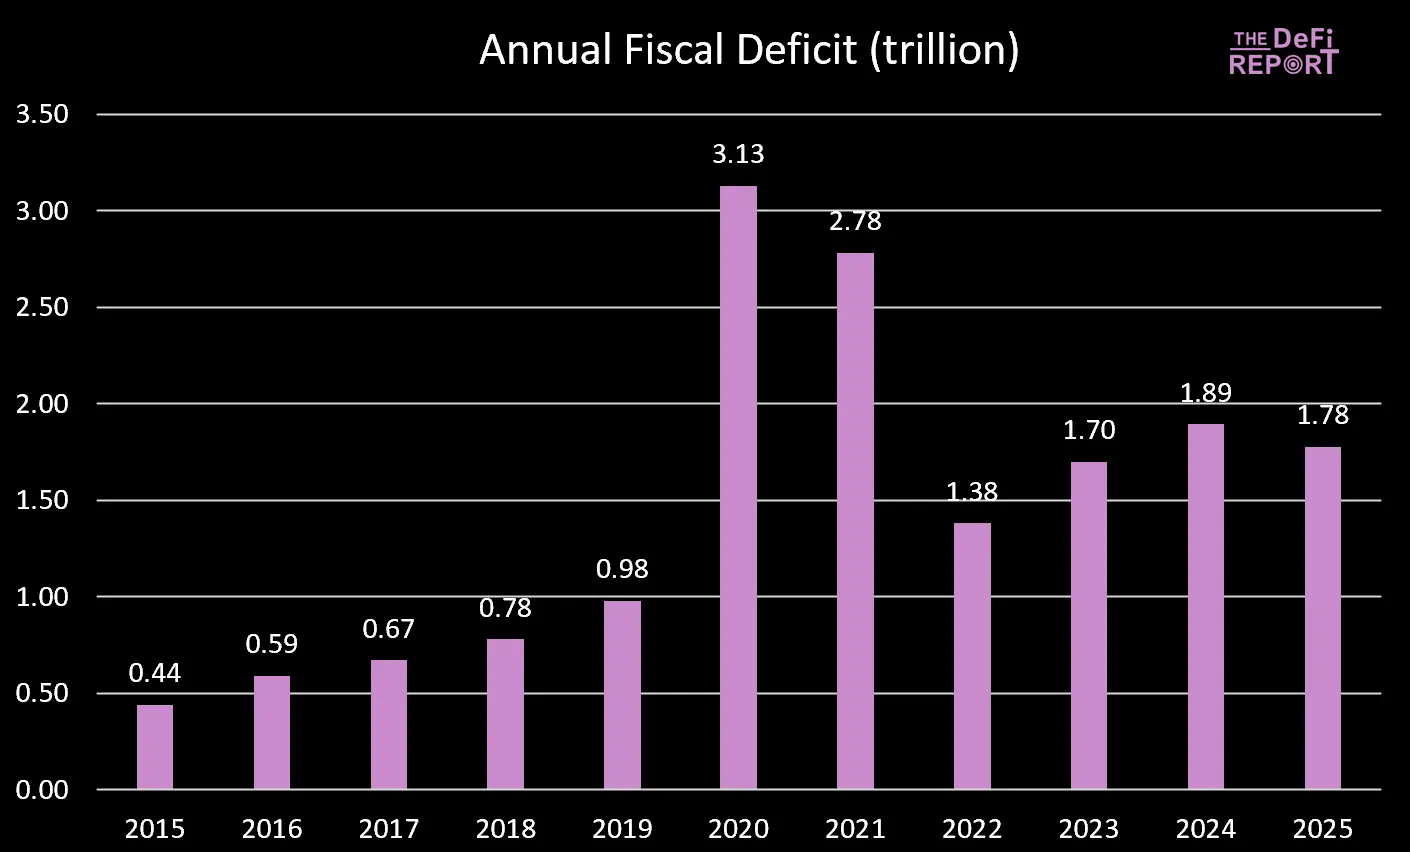
Data: US Treasury

The fiscal year 2025 has just ended, and the deficit has narrowed slightly—primarily due to increased taxes (tariffs) rather than reduced spending. However, the Big Beautiful Bill is expected to achieve spending cuts by reducing benefits from Medicaid and the Supplemental Nutrition Assistance Program (SNAP).
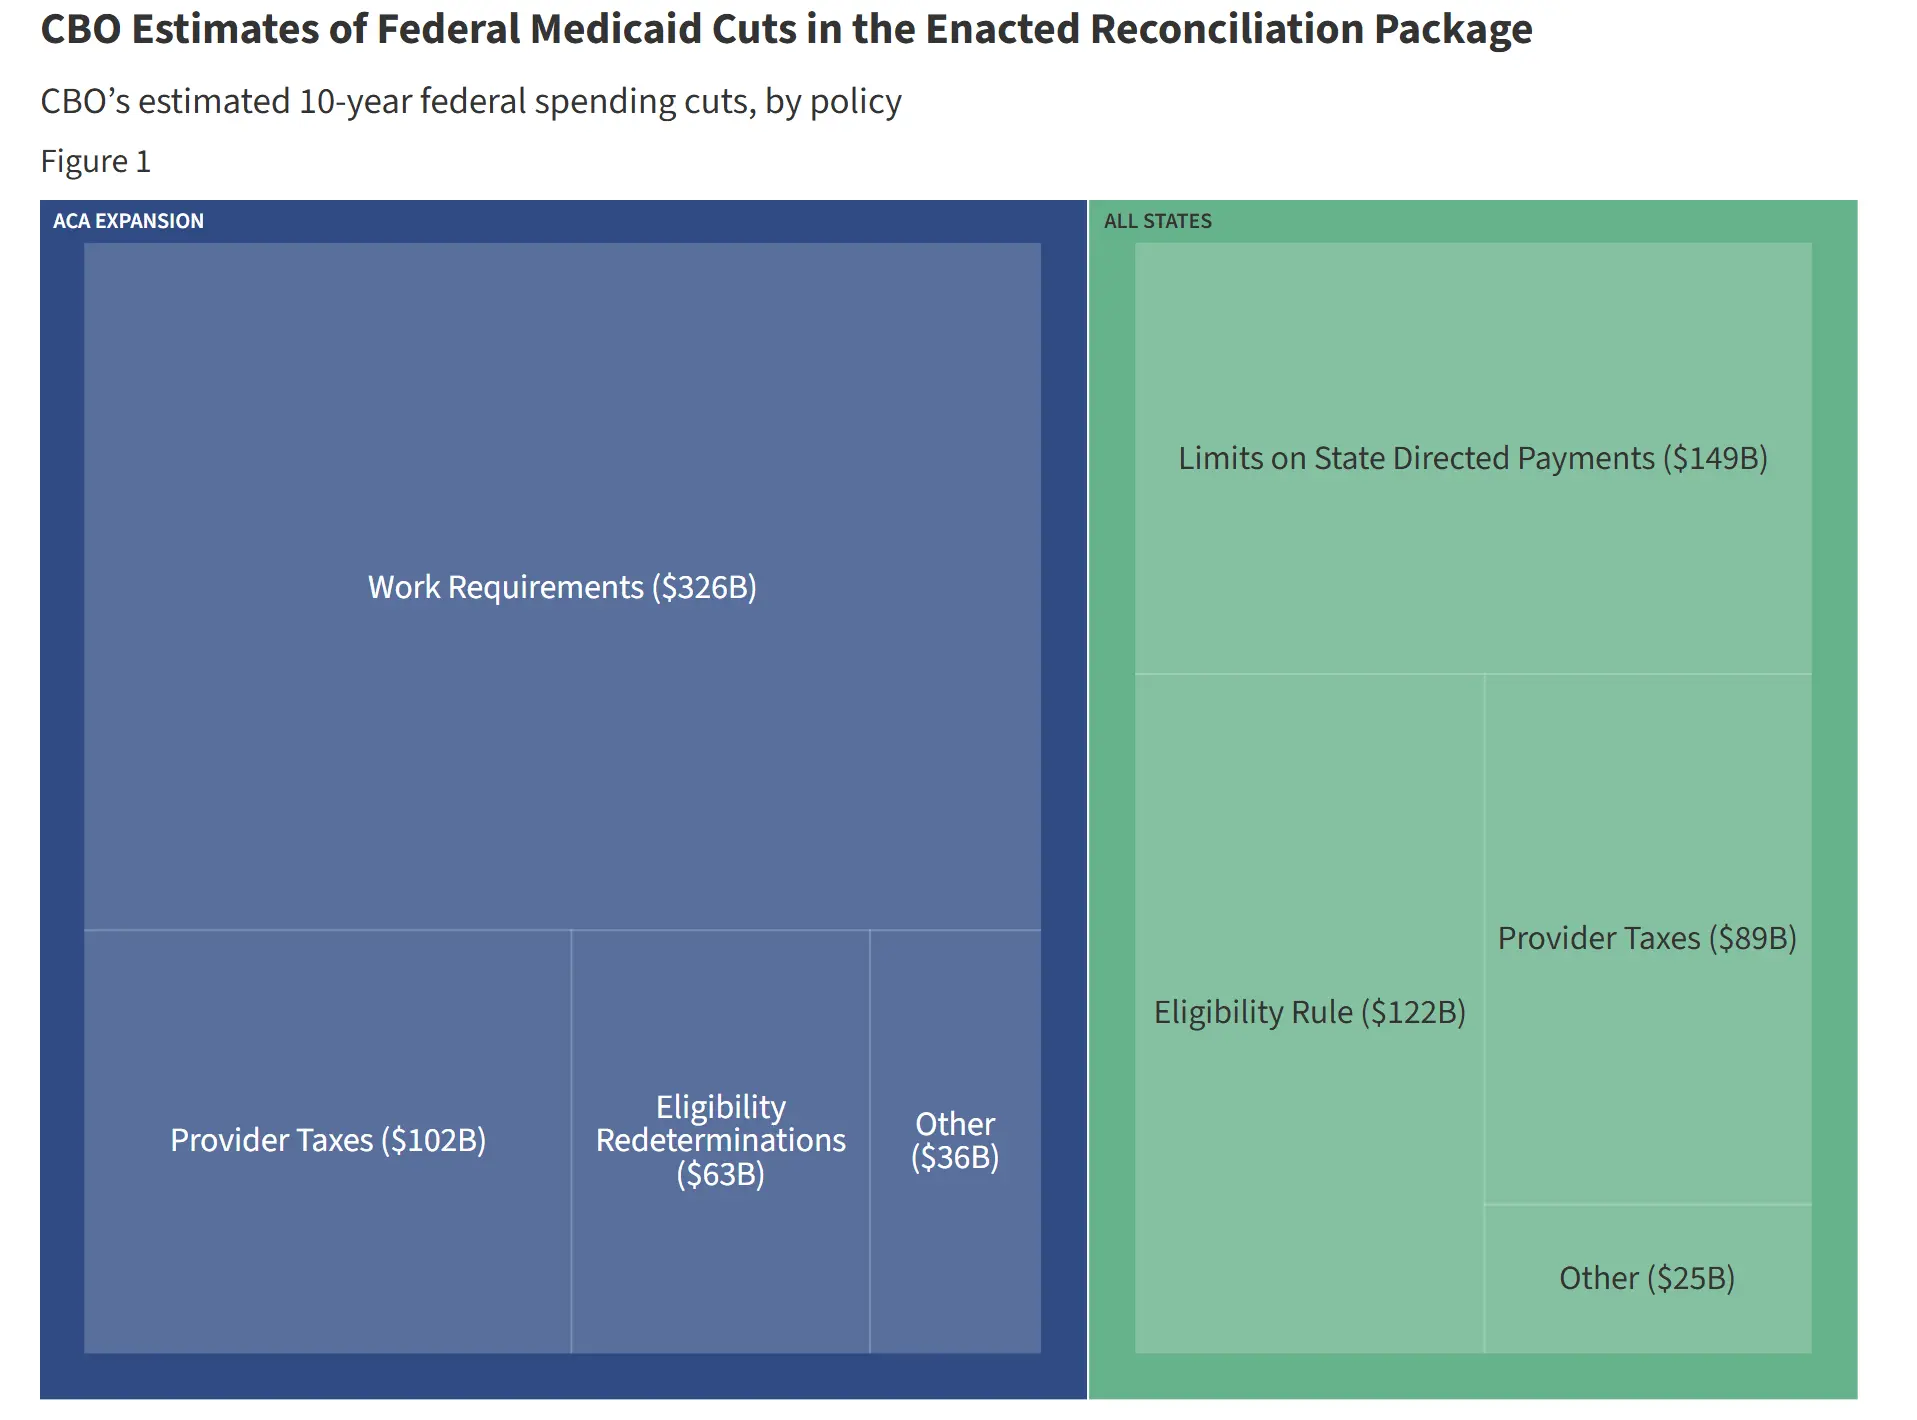
Data: Comparison of KFF (Kaiser Family Foundation) cuts with current spending trajectory

During Biden's presidency, government spending and transfer payments continuously injected liquidity into the economy. However, under the Great America Act, spending growth slowed.

This means that the government is injecting less money into the economy.

In addition, the government is withdrawing funds from the economy through tariffs.
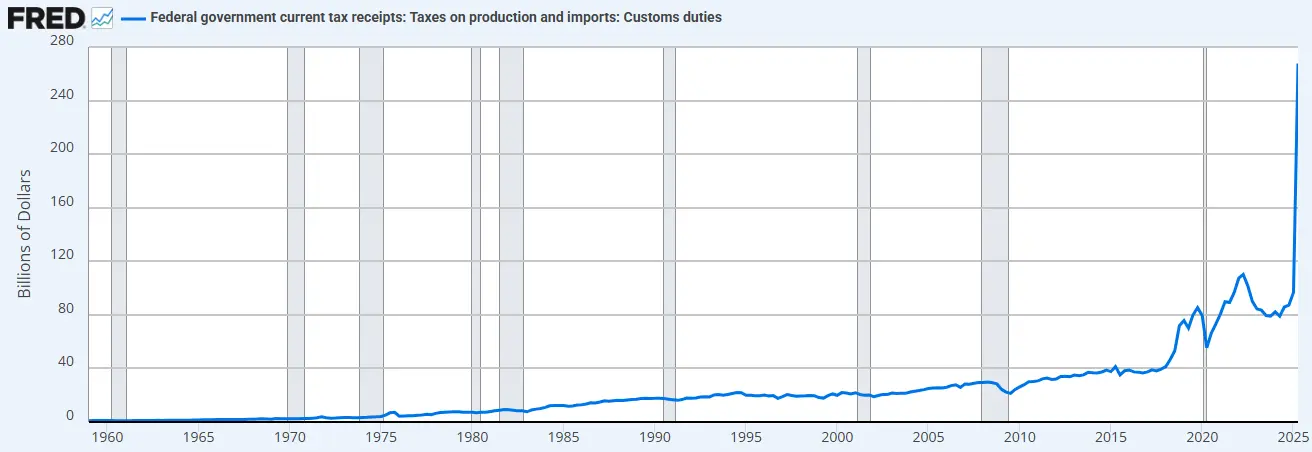
Data: FRED (St. Louis Federal Reserve Economic Data)

The combination of spending restrictions (relative to the previous administration) and increased tariffs means that the Treasury is now absorbing liquidity rather than supplying it.

This is why we need to cut interest rates.

"We will privatize the economy, revitalize the private sector, and shrink the government." - Scott Bessent

2. "Treasury QE". To fund the excessive spending by the Treasury during the Biden administration, we also saw a new form of "quantitative easing" (QE). We can observe this below (black line). "Treasury QE" supported the market by funding government spending through short-term notes rather than long-term bonds.
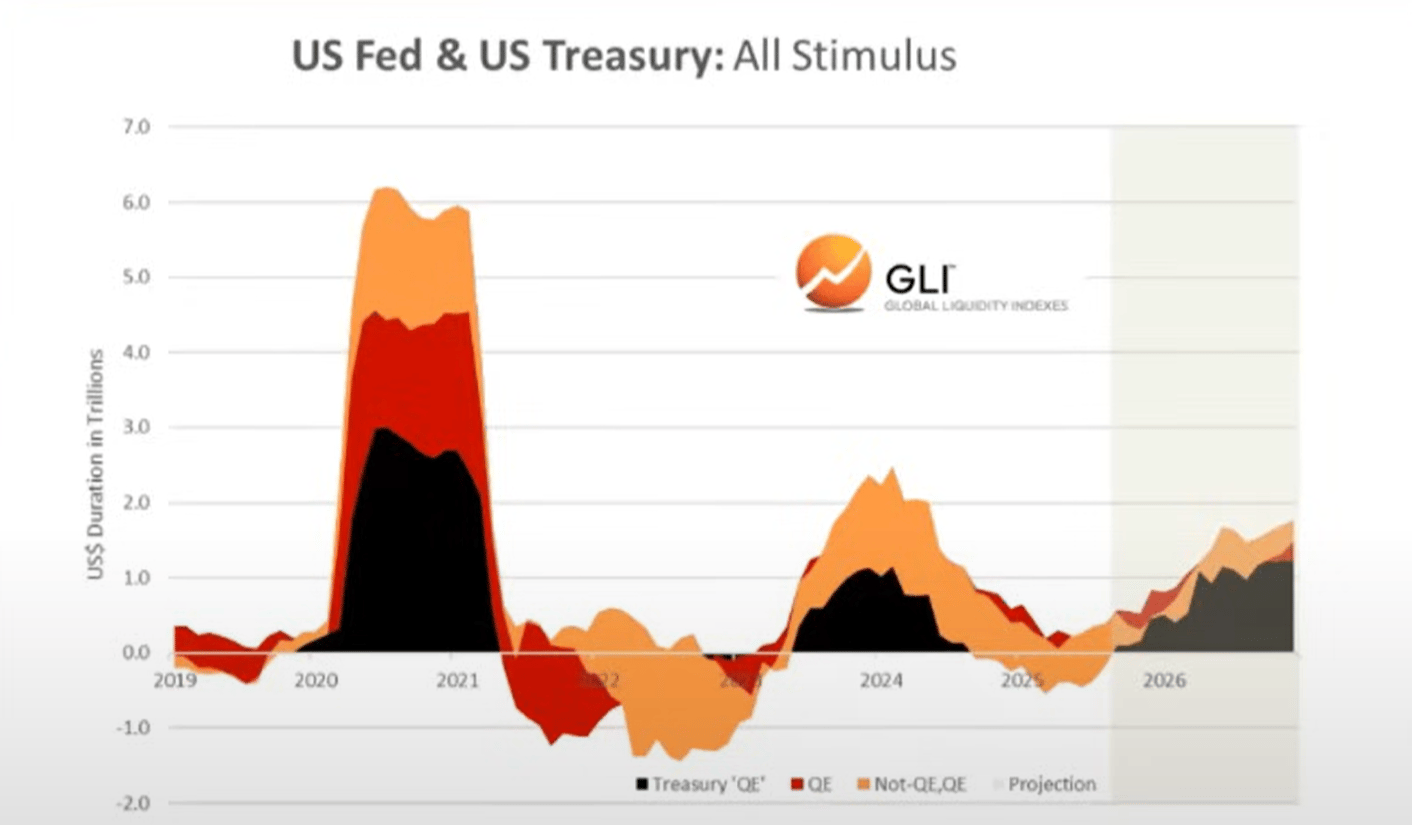
Data: Global Liquidity Index

We believe that fiscal spending and quantitative easing by the Treasury have fueled the “devaluation trade” and “everything bubble” that we have seen in the past few years.

But now we are transitioning to a "Trump economy," with the private sector taking over the reins from the Treasury.

Similarly, this is why they need to lower interest rates. They need to use bank loans to stimulate the private sector.

As we enter this transition period, the global liquidity cycle appears to be peaking...

The global liquidity cycle is peaking and declining.

Current cycle and average cycle

Below, we can observe a comparison between the current cycle (red line) and the historical average cycle (gray line) since 1970.
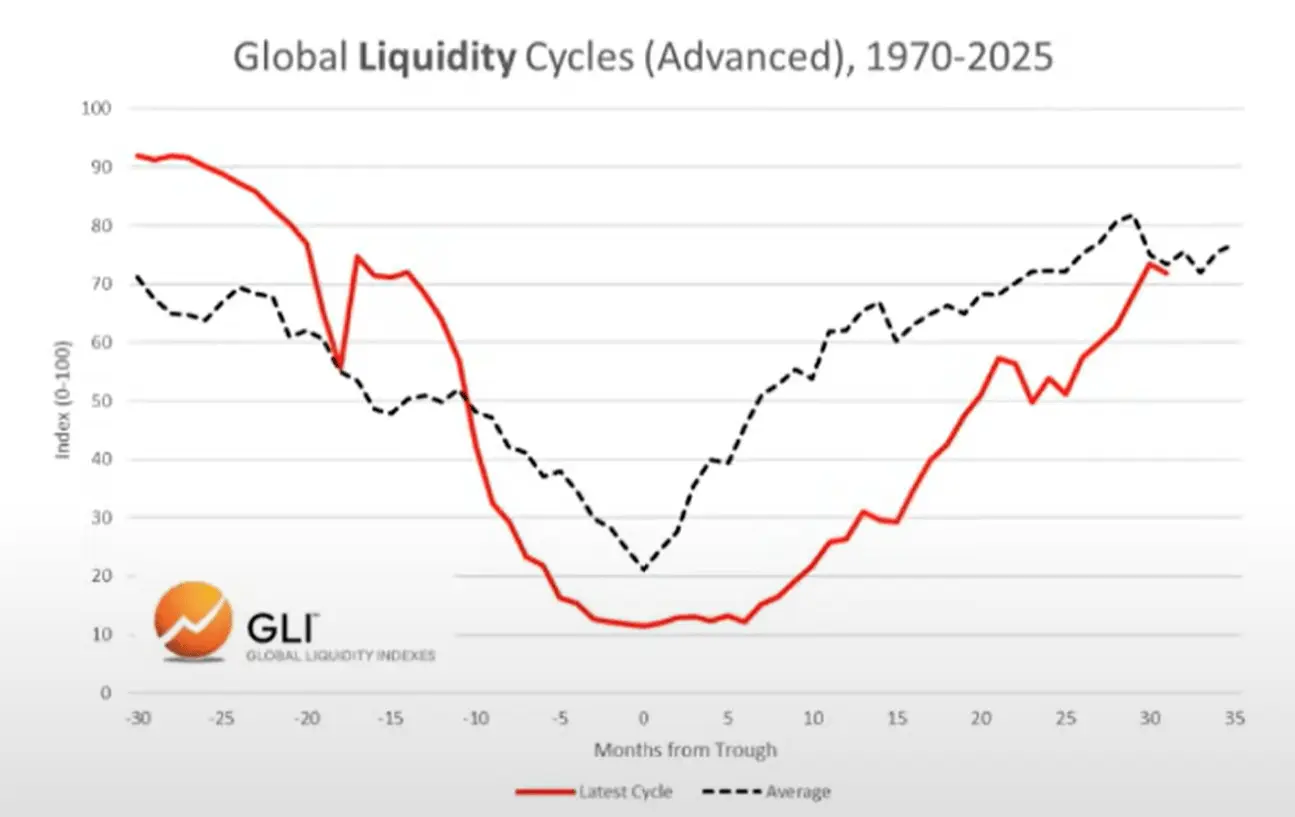
Data: Global Liquidity Index

Asset allocation

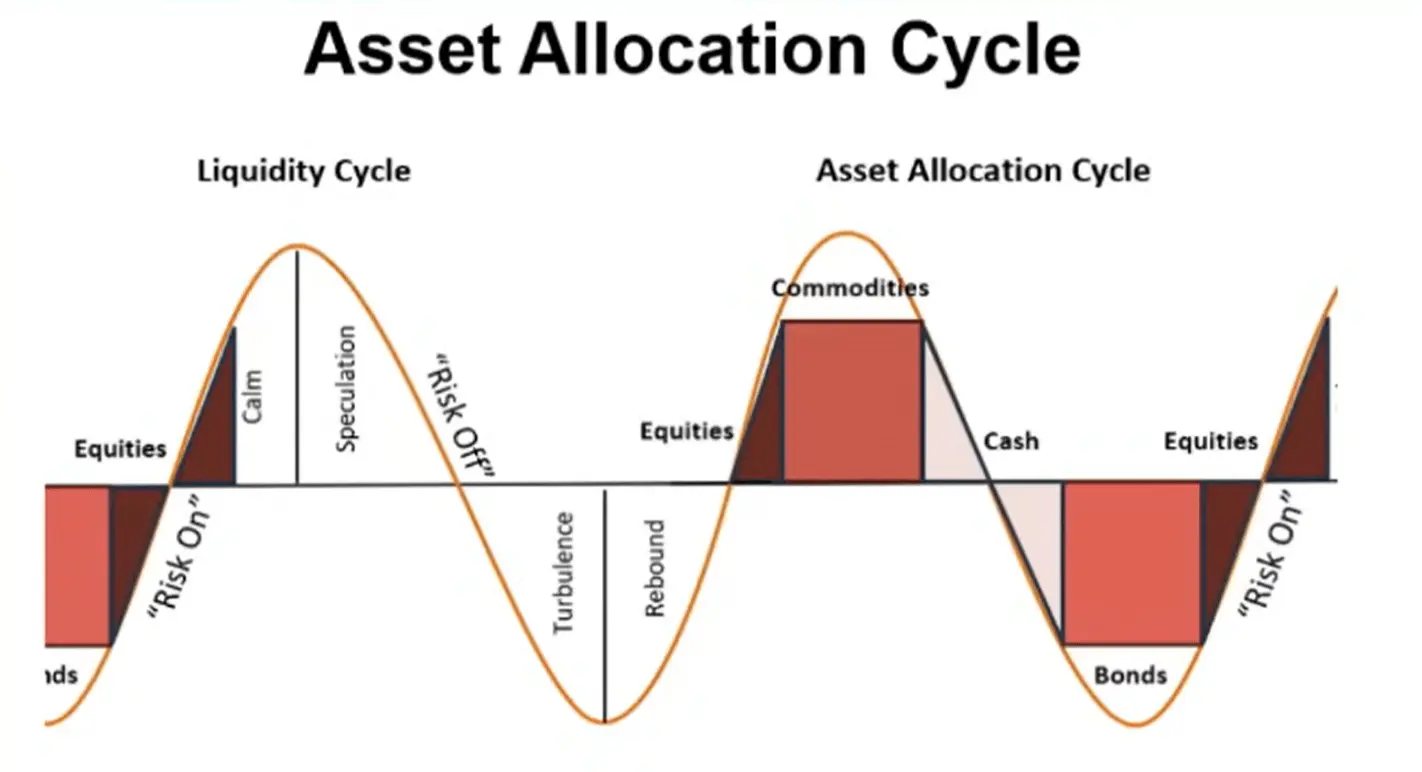
Based on Mr. Howell's work on global liquidity indices, we can observe typical liquidity cycles and their alignment with asset allocation.

Commodities are often the last assets to fall, which is exactly what we are seeing today (gold, silver, copper, palladium).

From this perspective, the current cycle looks very typical.
Data: Global Liquidity Index

So, if liquidity is indeed peaking, we expect investors to rotate into cash and bonds as the environment changes. To be clear, this process hasn't even begun yet (the market remains "risk-averse").

Debt and Liquidity

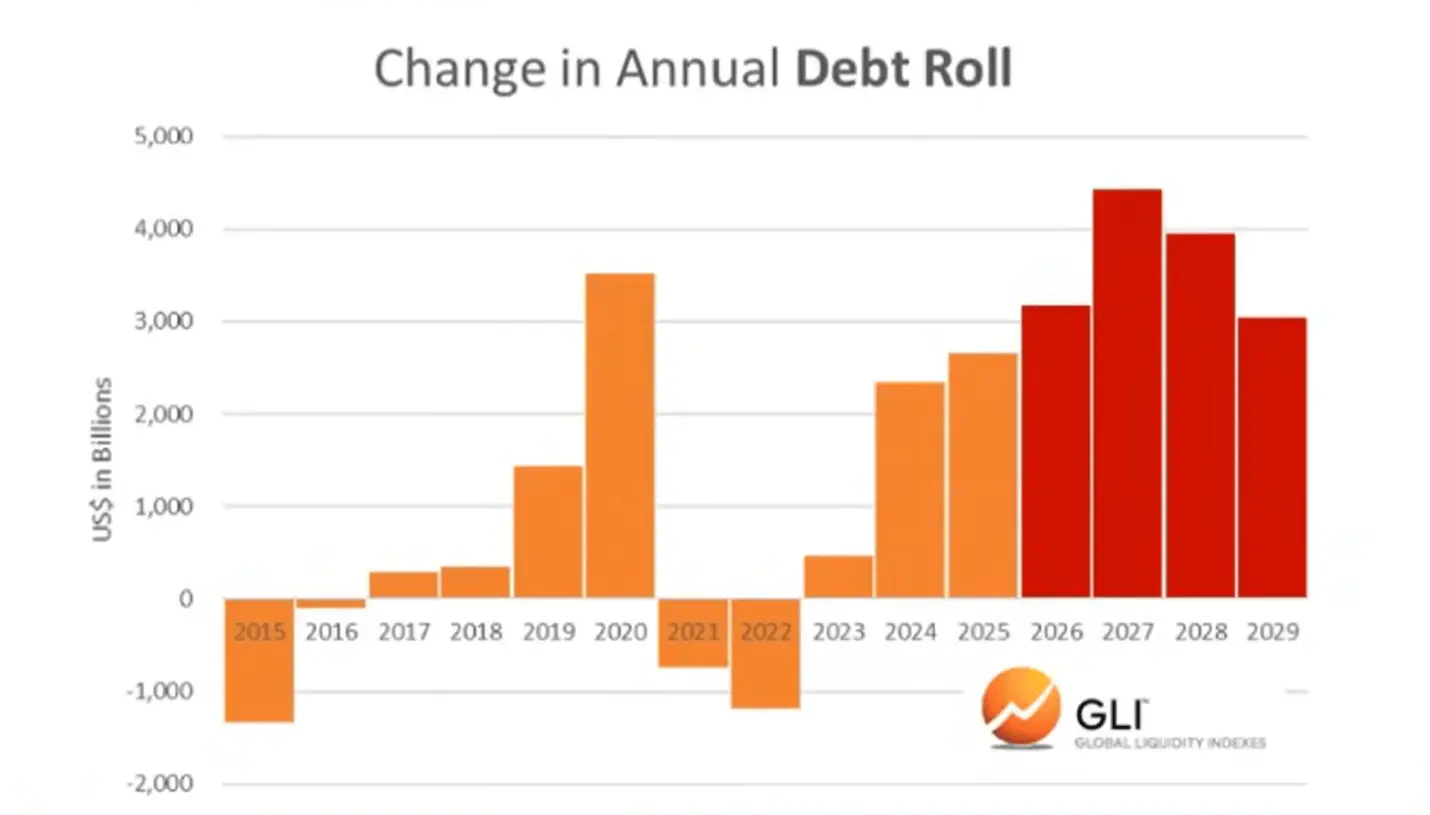
According to the Global Liquidity Index, the debt-to-liquidity ratio of major economies reached its lowest level since 1980 at the end of last year. It is now rising and is expected to continue rising until 2026.
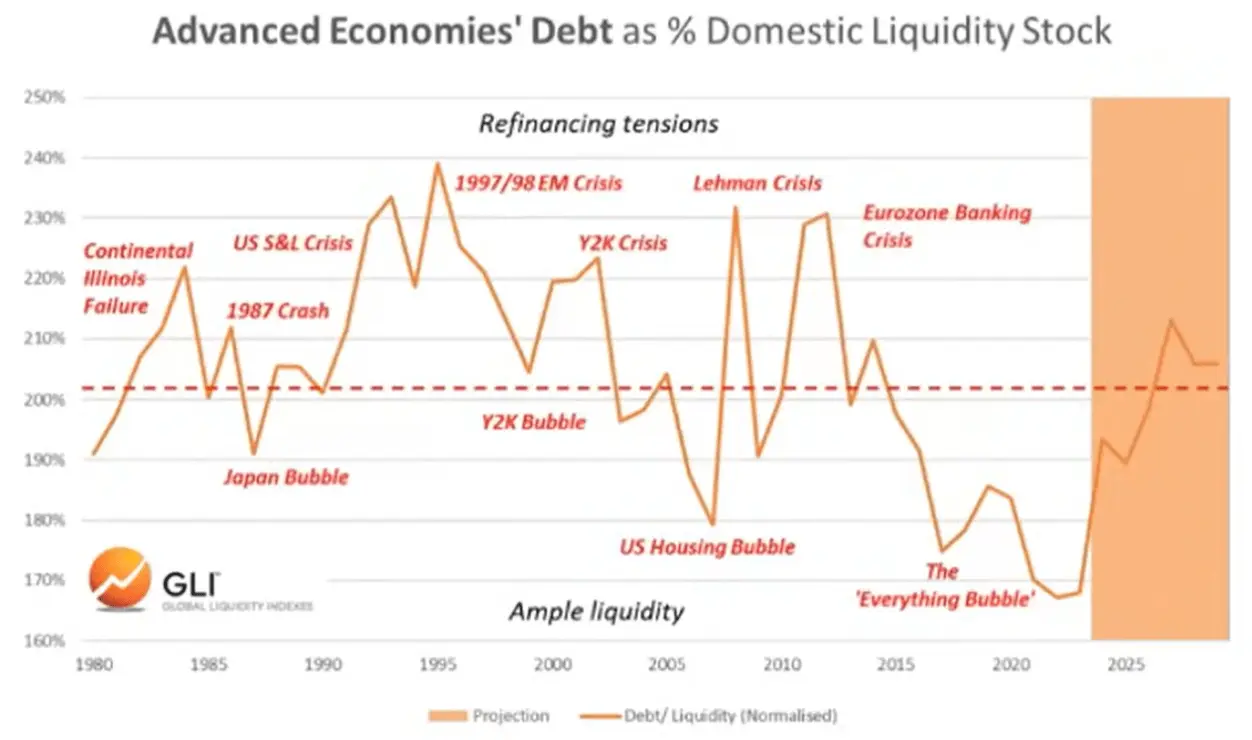
Data: Global Liquidity Index

The rising debt-to-liquidity ratio makes it more difficult to service trillions of dollars of outstanding debt that need to be refinanced.
Data: Global Liquidity Index

Bitcoin and Global Liquidity

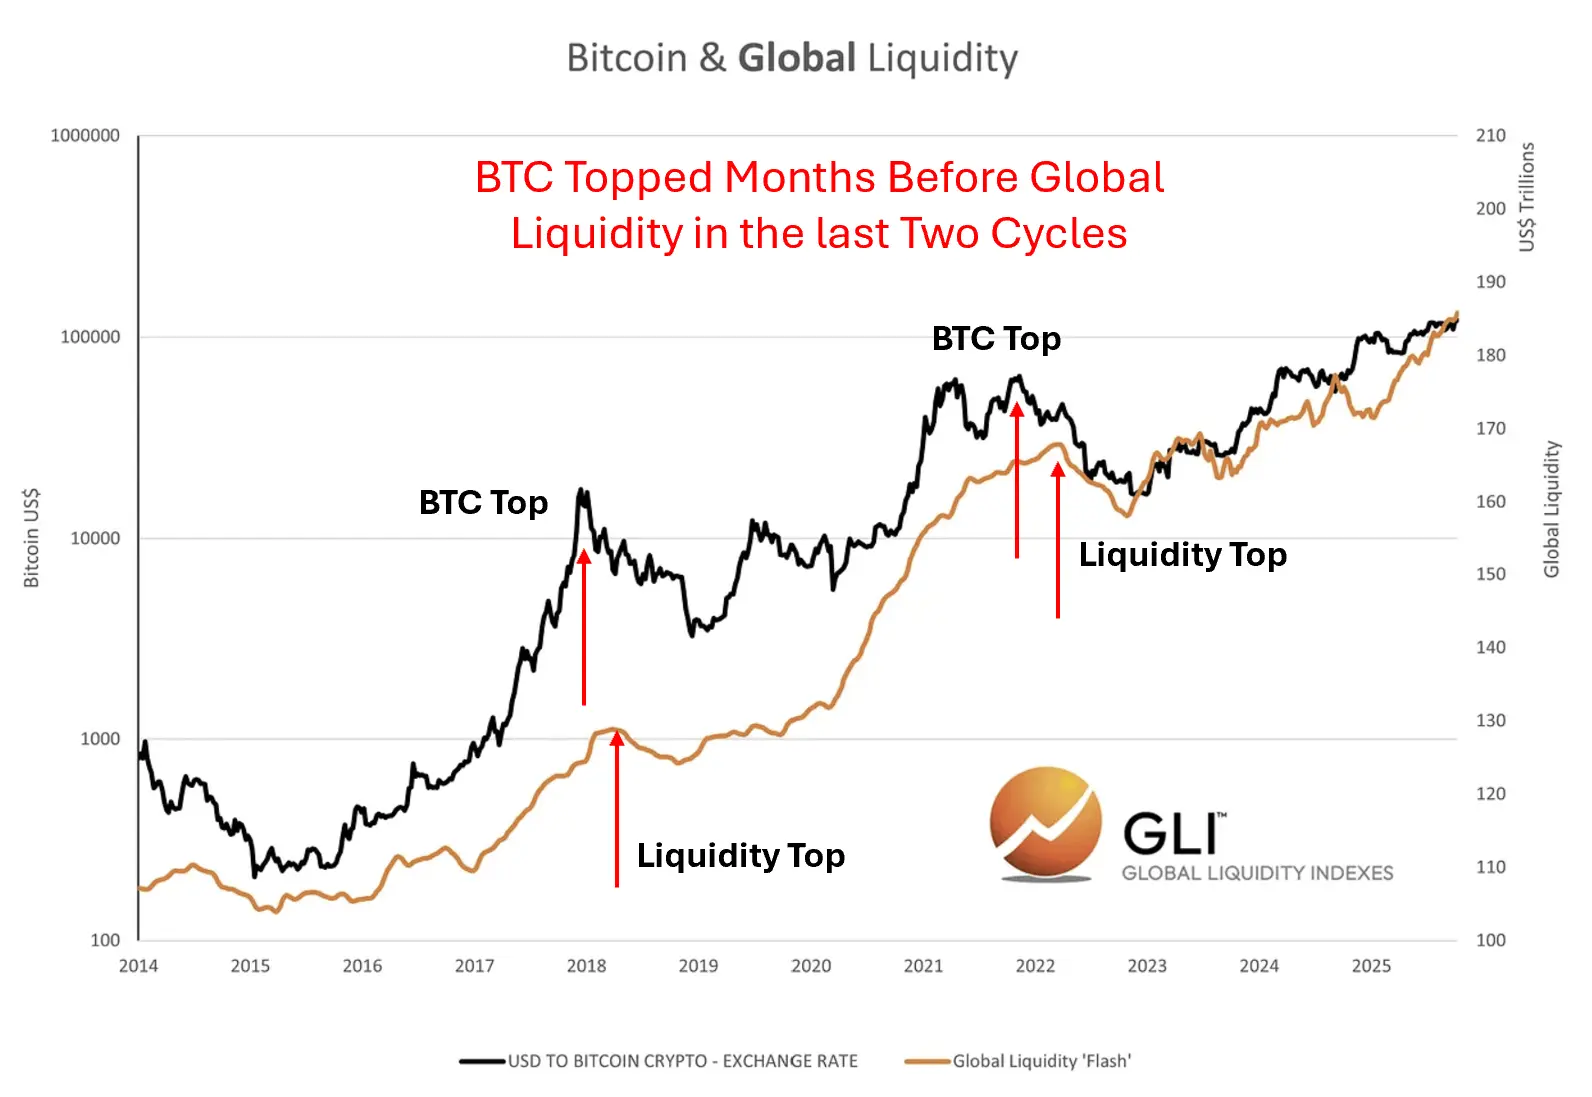
Of course, Bitcoin has "foreshadowed" peak global liquidity in the past two cycles. In other words, Bitcoin peaked months before liquidity peaked and began to decline, seemingly anticipating the subsequent drop.
Data: Global Liquidity Index

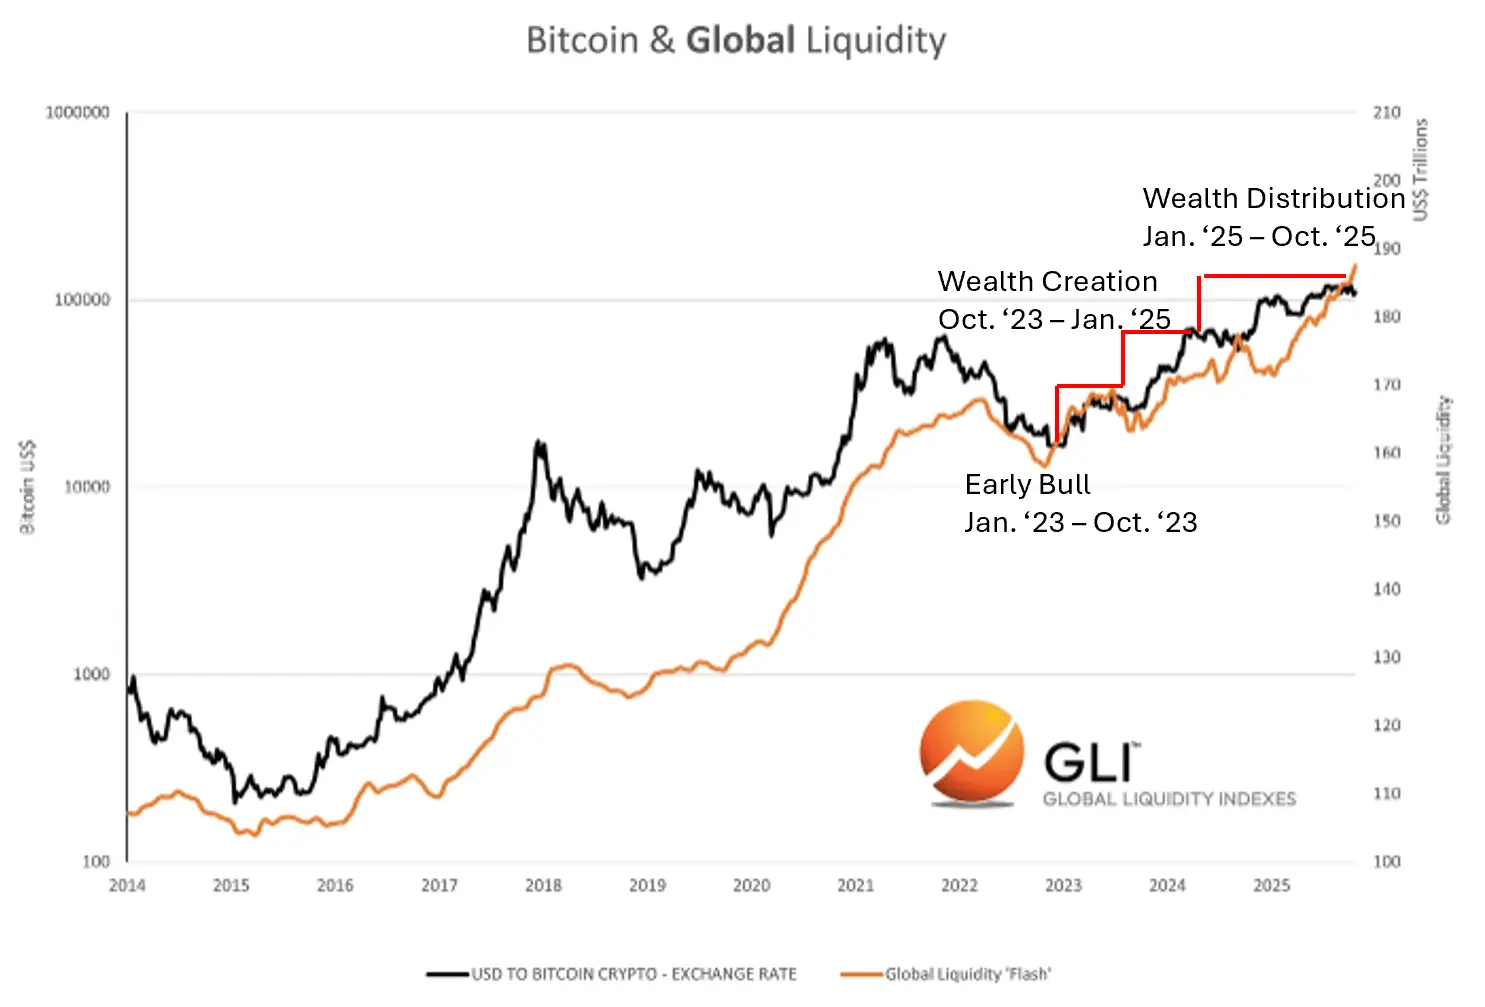
We don't know if this is happening right now. But we do know that cryptocurrency cycles always closely follow liquidity cycles.

Alignment with the cryptocurrency cycle
Data: Global Liquidity Index

Disclaimer: The articles reposted on this site are sourced from public platforms and are provided for informational purposes only. They do not necessarily reflect the views of MEXC. All rights remain with the original authors. If you believe any content infringes on third-party rights, please contact [email protected] for removal. MEXC makes no guarantees regarding the accuracy, completeness, or timeliness of the content and is not responsible for any actions taken based on the information provided. The content does not constitute financial, legal, or other professional advice, nor should it be considered a recommendation or endorsement by MEXC.
Share Insights

You May Also Like

UK FCA Plans to Waive Some Rules for Crypto Companies: FT

UK FCA Plans to Waive Some Rules for Crypto Companies: FT

The post UK FCA Plans to Waive Some Rules for Crypto Companies: FT appeared on BitcoinEthereumNews.com. The U.K.’s Financial Conduct Authority (FCA) has plans to waive some of its rules for cryptocurrency companies, according to a Financial Times (FT) report on Wednesday. However, in another areas the FCA intends to tighten the rules where they pertain to industry-specific risks, such as cyber attacks. The financial watchdog wishes to adapt its existing rules for financial service companies to the unique nature of cryptoassets, the FT reported, citing a consultation paper published Wednesday. “You have to recognize that some of these things are very different,” David Geale, the FCA’s executive director for payments and digital finance, said in an interview, according to the report, adding that a “lift and drop” of existing traditional finance rules would not be effective with crypto. One such area that may be handled differently is the stipulation that a firm “must conduct its business with integrity” and “pay due regard to the interest of its customers and treat them fairly.” Crypto companies would be given less strict requirements than banks or investment platforms on rules concerning senior managers, systems and controls, as cryptocurrency firms “do not typically pose the same level of systemic risk,” the FCA said. Firms would also not have to offer customers a cooling off period due to the voltatile nature of crypto prices, nor would technology be classed as an outsourcing arrangement requiring extra risk management. This is because blockchain technology is often permissionless, meaning anyone can participate without the input of an intermediary. Other areas of crypto regulation remain undecided. The FCA has plans to fully integrate cryptocurrency into its regulatory framework from 2026. Source: https://www.coindesk.com/policy/2025/09/17/uk-fca-plans-to-waive-some-rules-for-crypto-companies-ft
Share
BitcoinEthereumNews2025/09/18 04:15
Cardano Price Prediction: Will ADA Reach $5 in 2025, and Can Mutuum Finance (MUTM) Beats Its ROI This Cycle?

Cardano Price Prediction: Will ADA Reach $5 in 2025, and Can Mutuum Finance (MUTM) Beats Its ROI This Cycle?

The post Cardano Price Prediction: Will ADA Reach $5 in 2025, and Can Mutuum Finance (MUTM) Beats Its ROI This Cycle? appeared on BitcoinEthereumNews.com. Cardano (ADA) has been the toughest Ethereum competitor for a while, and there are some bulls contemplating a push towards $5 should the upcoming market cycle work out. However, while ADA’s promise is supported by sustained adoption and network growth, Mutuum Finance (MUTM) is building up steam for its explosive ROI prospects.  At just $0.035 in presale, MUTM is built on a twin lending-and-borrowing platform for real-world utility that creates a growth narrative stronger than ADA’s. Mutuum Finance could leave Cardano much behind before ADA even reaches $5. Cardano: Resistance Ahead Amid Strong Fundamentals Cardano (ADA) is trading around $0.90, with recent price movement capped by resistance just above $1.00. In this scenario, price action shows that while support at $0.80 remains solid, significant upside may be difficult under current conditions without new catalysts or increased capital flows. Network expansion is still going on at a slow pace, governance upgrades, staking rewards, and smart contract enhancement are ongoing, which keeps ADA’s basement price intact. However, comparatively speaking, Mutuum Finance is offering higher potential return under current market conditions. Mutuum Finance (MUTM) Exceeds Expectations Mutuum Finance is now in stage six of its presale at $0.035 after its 16.17% increase from the previous stage. The market is witnessing unprecedented demand for the project where more than 16,410 investors have joined and exceeded $16.1 million in funds raised. Mutuum Finance (MUTM) also initiated a $50,000 USDT Bug Bounty Program for the platform’s security. The bugs have been segmented on four levels depending on the tag critical, major, minor, and low. Mutuum Finance possesses strong safety measures for any asset which is collateraled so that protocol’s and user’s safety are not lost. They possess target collateral ratios, lending and deposit limits. Off close undercollateralized positions are incentivized as a means of maintaining systemic…
Share
BitcoinEthereumNews2025/09/21 00:42