TLDR SOS surges after hours despite widening losses and sharp cash depletion. SOS pivots to commodities; revenue up, but losses and cash risks grow. SOS earnings lift stock post-market as revenue jumps 48% on rubber sales. SOS revenue surges, but losses deepen and liquidity remains a concern. SOS stock rallies after hours on growth, despite [...] The post SOS Limited (SOS) Stock: Revenue Surges 48%, But Net Loss and Cash Burn Raise Red Flags appeared first on CoinCentral.TLDR SOS surges after hours despite widening losses and sharp cash depletion. SOS pivots to commodities; revenue up, but losses and cash risks grow. SOS earnings lift stock post-market as revenue jumps 48% on rubber sales. SOS revenue surges, but losses deepen and liquidity remains a concern. SOS stock rallies after hours on growth, despite [...] The post SOS Limited (SOS) Stock: Revenue Surges 48%, But Net Loss and Cash Burn Raise Red Flags appeared first on CoinCentral.

SOS Limited (SOS) Stock: Revenue Surges 48%, But Net Loss and Cash Burn Raise Red Flags

2025/09/27 05:08

TLDR

  • SOS surges after hours despite widening losses and sharp cash depletion.
  • SOS pivots to commodities; revenue up, but losses and cash risks grow.
  • SOS earnings lift stock post-market as revenue jumps 48% on rubber sales.
  • SOS revenue surges, but losses deepen and liquidity remains a concern.
  • SOS stock rallies after hours on growth, despite cash crunch and losses.

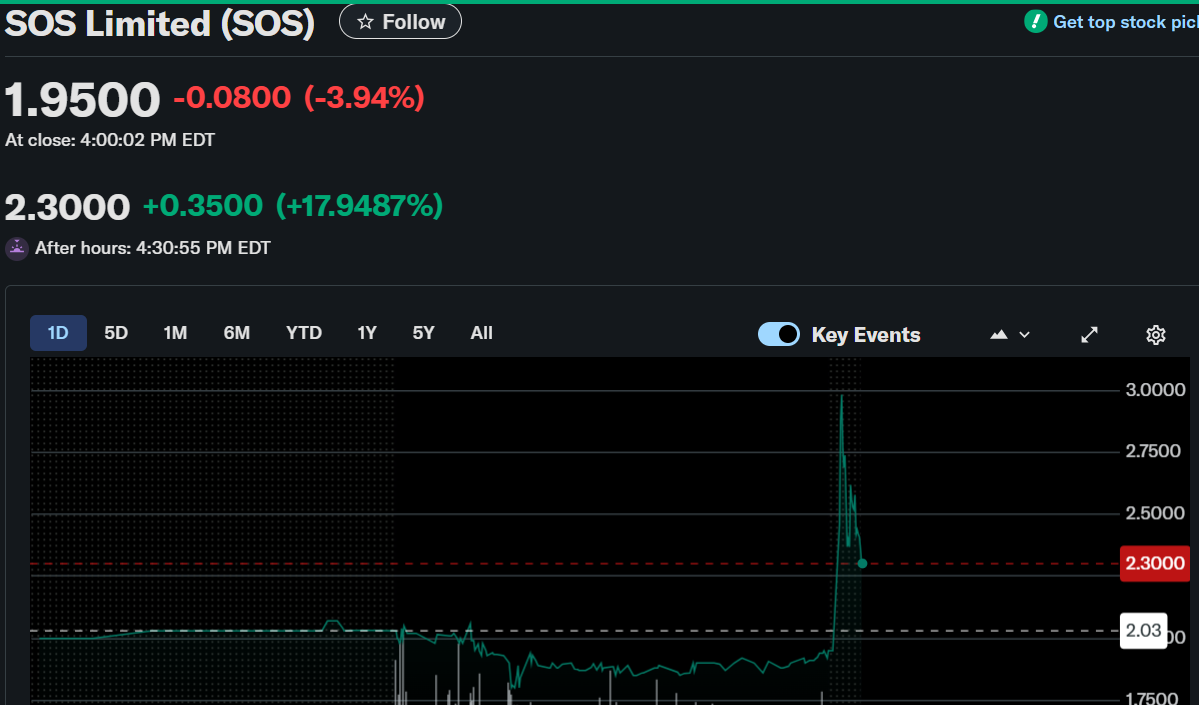
SOS stock closed at $1.95 during regular trading on September 26, 2025, down 3.94% from the prior session. However, shares surged 17.95% after hours to $2.30 following the earnings release. The contrasting stock reaction reflects optimism around revenue growth but concern over losses and cash depletion.

SOS Limited (SOS

Revenue Growth Driven by Commodities Trading

SOS Limited reported semi-annual results for the six months ended June 30, 2025. The company achieved revenue of $89.6 million, reflecting a 48.1% increase from the prior year. Growth came mainly from higher natural rubber sales as demand in China recovered steadily.

The commodities trading segment contributed 94.9% of revenue, while hosting services delivered 4.3% and others provided 0.8%. The company shifted away from cryptocurrency mining operations to focus on hosting services. Management highlighted stronger demand for third-party hosting despite suspending self-mining.

Nevertheless, despite higher revenue, SOS faced a gross loss of $1.3 million, reversing a gross profit of $2.4 million in 2024. The gross margin stood at negative 1.5%, down from a positive 4% in the previous year. Falling rubber spot prices and losses from petroleum coke weighed heavily on profitability.

Losses Widen and Costs Escalate

The company recorded a GAAP net loss of $14.2 million, a 30.3% increase from last year’s $10.9 million. Operating costs surged 56.5% to $90.9 million, outpacing revenue growth and further pressuring margins. Selling expenses rose slightly to $2.3 million, mainly due to higher transportation costs.

General and administrative expenses dropped 35% to $9.4 million as mining machines were fully impaired and required no depreciation. However, this reduction did not offset the broader rise in costs across operations. The loss per share was $(0.0139), compared with $(0.0299) a year earlier.

The company sold petroleum coke inventory at cost and absorbed over $1.6 million in losses from rubber price declines. Management emphasized a strategy of pursuing market share over short-term profitability. Competitive pricing was prioritized to maintain trading volume amid challenging conditions.

Liquidity Risks and Strategic Investments

Cash and cash equivalents fell sharply to $4.2 million from $246.7 million a year earlier. The decline of 98.3% resulted mainly from a $228.4 million prepayment for blockchain commodity trading platform development. Management described the payment as a move to secure long-term value and secure critical partner resources.

During the reporting period, the company raised $6.8 million in net proceeds through a registered direct offering under Form F-3. Despite this, liquidity remains constrained, and further capital raising plans have been confirmed. The shift underscores the company’s ongoing dependence on external funding to sustain operations.


The post SOS Limited (SOS) Stock: Revenue Surges 48%, But Net Loss and Cash Burn Raise Red Flags appeared first on CoinCentral.

Disclaimer: The articles reposted on this site are sourced from public platforms and are provided for informational purposes only. They do not necessarily reflect the views of MEXC. All rights remain with the original authors. If you believe any content infringes on third-party rights, please contact [email protected] for removal. MEXC makes no guarantees regarding the accuracy, completeness, or timeliness of the content and is not responsible for any actions taken based on the information provided. The content does not constitute financial, legal, or other professional advice, nor should it be considered a recommendation or endorsement by MEXC.
Share Insights

You May Also Like

Microsoft Corp. $MSFT blue box area offers a buying opportunity

Microsoft Corp. $MSFT blue box area offers a buying opportunity

The post Microsoft Corp. $MSFT blue box area offers a buying opportunity appeared on BitcoinEthereumNews.com. In today’s article, we’ll examine the recent performance of Microsoft Corp. ($MSFT) through the lens of Elliott Wave Theory. We’ll review how the rally from the April 07, 2025 low unfolded as a 5-wave impulse followed by a 3-swing correction (ABC) and discuss our forecast for the next move. Let’s dive into the structure and expectations for this stock. Five wave impulse structure + ABC + WXY correction $MSFT 8H Elliott Wave chart 9.04.2025 In the 8-hour Elliott Wave count from Sep 04, 2025, we saw that $MSFT completed a 5-wave impulsive cycle at red III. As expected, this initial wave prompted a pullback. We anticipated this pullback to unfold in 3 swings and find buyers in the equal legs area between $497.02 and $471.06 This setup aligns with a typical Elliott Wave correction pattern (ABC), in which the market pauses briefly before resuming its primary trend. $MSFT 8H Elliott Wave chart 7.14.2025 The update, 10 days later, shows the stock finding support from the equal legs area as predicted allowing traders to get risk free. The stock is expected to bounce towards 525 – 532 before deciding if the bounce is a connector or the next leg higher. A break into new ATHs will confirm the latter and can see it trade higher towards 570 – 593 area. Until then, traders should get risk free and protect their capital in case of a WXY double correction. Conclusion In conclusion, our Elliott Wave analysis of Microsoft Corp. ($MSFT) suggested that it remains supported against April 07, 2025 lows and bounce from the blue box area. In the meantime, keep an eye out for any corrective pullbacks that may offer entry opportunities. By applying Elliott Wave Theory, traders can better anticipate the structure of upcoming moves and enhance risk management in volatile markets. Source: https://www.fxstreet.com/news/microsoft-corp-msft-blue-box-area-offers-a-buying-opportunity-202509171323
Share
BitcoinEthereumNews2025/09/18 03:50