Whales Offload 1 Billion Dogecoin, DOGE Struggles Below $0.17 Resistance

- Dogecoin whales sold over 1 billion DOGE in a week, driving prices lower.
- Price dropped 15.75% in a week, struggling below key resistance at $0.17.
- Technical indicators point to weak momentum and possible further correction.
Dogecoin has entered a turbulent phase after large holders reportedly sold over 1 billion DOGE in the past week, according to market analyst Ali.
This heavy sell-off has weighed on market sentiment, pushing the meme coin to trade around $0.1573, reflecting a weekly loss of nearly 15.75%.
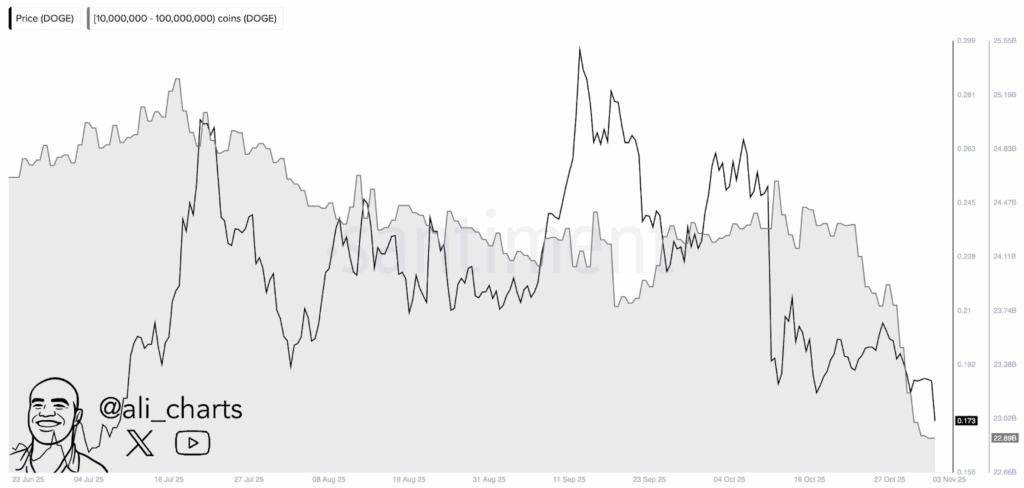
The decline followed multiple failed attempts to break the strong resistance area between $0.18 and $0.19, where buying momentum has repeatedly faded.
The current chart setup highlights a series of red candles, showing intensified selling pressure. Technical experts note that the price is now moving away from the upper Bollinger Band, a sign that the recent rally may have lost strength.
The narrowing Bollinger Bands, now positioned between $0.2188 and $0.2858, suggest a phase of possible consolidation after heightened volatility.
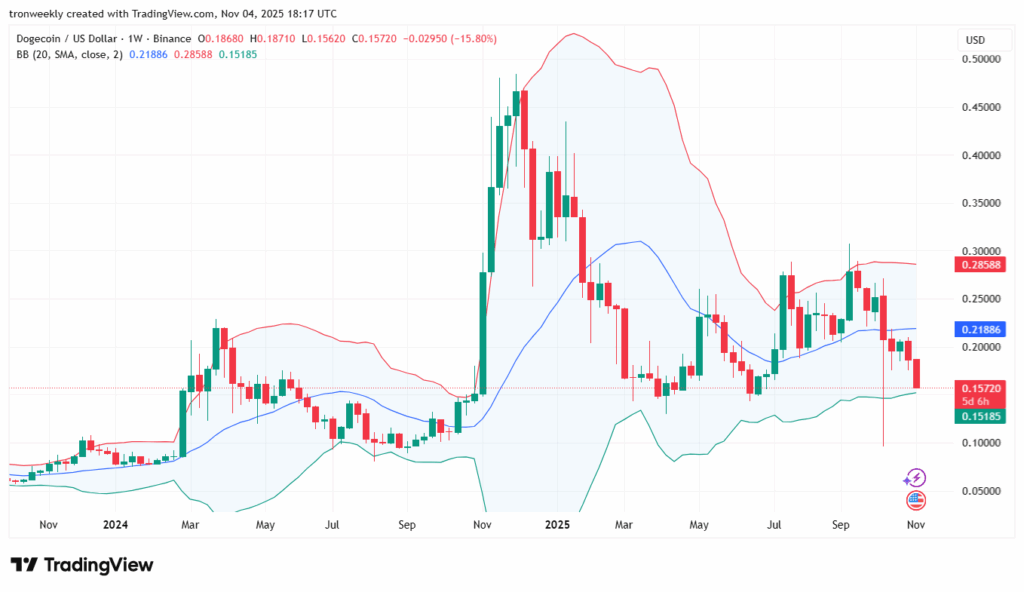
Historical Volatility remains elevated at 82.78, indicating that the market could continue seeing wide weekly swings before any meaningful stabilization occurs.
Also Read: Dogecoin (DOGE) Faces Tough Start to November After 20% October Drop
Technical Weakness Persists Below Key Fibonacci Level
The current technical charts for Dogecoin reveal weakness. The Auto Fibonacci indicator identifies the 0.786 level at approximately $0.164 as the resistance level.
At present, Dogecoin is holding below that level. This could trigger a move to the support levels of $0.15 and then to support at $0.138.
It is critical to maintain price action above the support levels to avoid a fall into a market correction. The current market indicators show that whales could continue to restructure their market positions with retail users proceeding with caution.
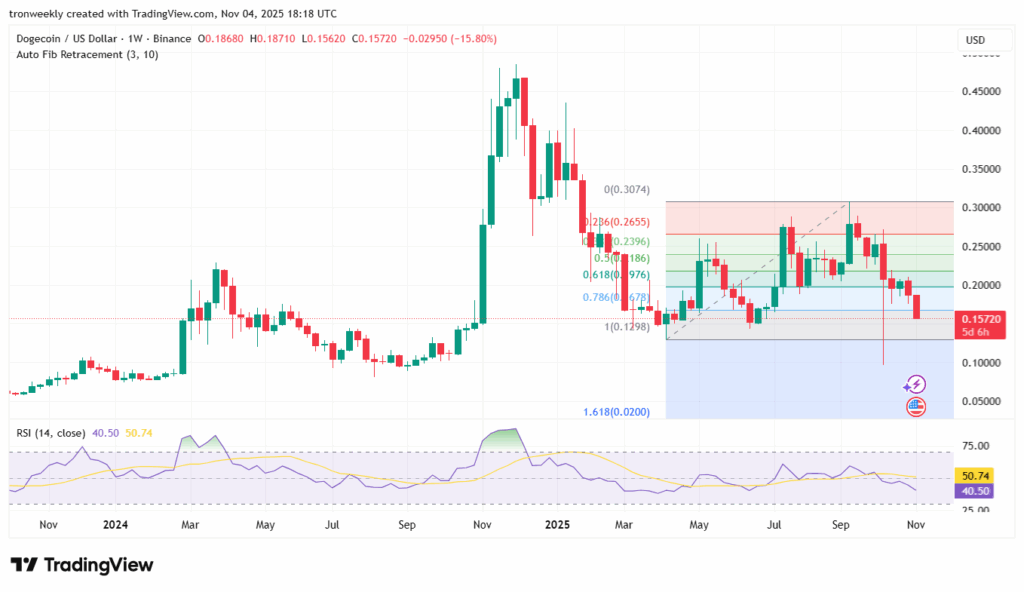
Also, the Relative Strength Index (RSI) is at 40.51, which is moderately bearish. This means that the selling pressure is still prevalent, although not to the extent of overselling.
A fall below 40 could spark intense selling pressure, while a rise above 50.7 could trigger a recovery.
Dogecoin Breakdown Below $0.15 Could Trigger Decline
The Moving Average Convergence Divergence (MACD) indicator is again supporting a bearish market. The MACD indicator with a value of -0.00743 is always below the Signal line with -0.00575.
The histogram is not indicative of a strong market trend. This indicates that Dogecoin may trade between certain levels or may move slowly downwards.
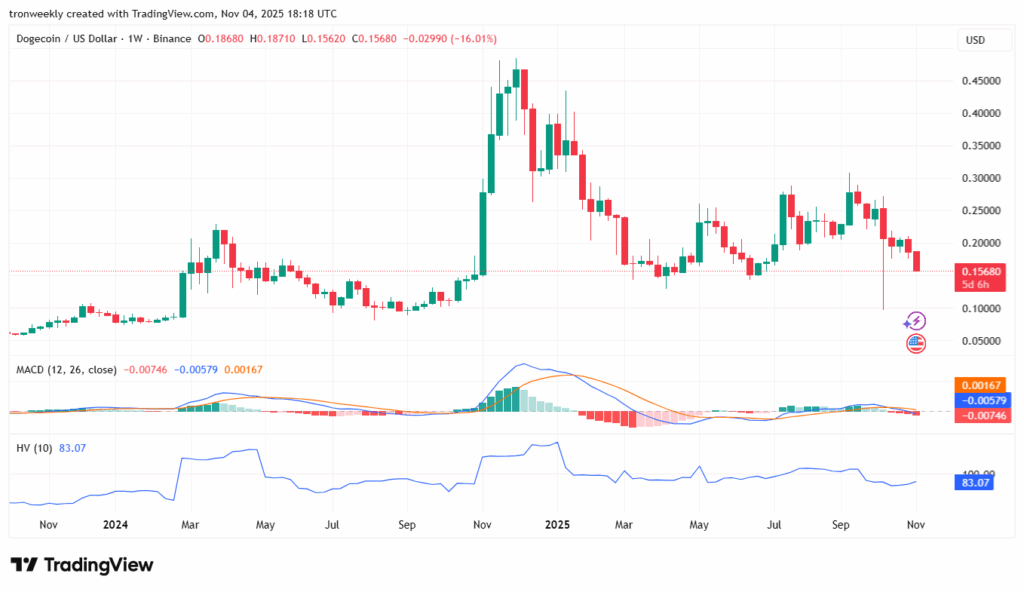
At the current pace, traders will focus on crucial resistance levels. The first resistance level is between $0.164 and $0.17. A strong break above $0.185 can spark buying interest. A fall below $0.15 could see prices move to $0.13.
Also Read: Dogecoin’s (DOGE) Slow Erosion: 40% Plunge Sparks Investor Fear
You May Also Like

CME Group to launch options on XRP and SOL futures

Ripple News: Ripple Hits $40 Billion Valuation After $500 Million Strategic Funding Round