

Improving Deep Learning with Lorentzian Geometry: Results from LHIER Experiments
Table of Links
Abstract and 1. Introduction
-
Related Work
-
Methodology
3.1 Background
3.2 Riemannian Optimization
3.3 Towards Efficient Architectural Components
-
Experiments
4.1 Hierarchical Metric Learning Problem
4.2 Standard Classification Problem
-
Conclusion and References
4 Experiments
4.1 Hierarchical Metric Learning Problem
\ In the following experiment, we extend HIER to the Lorentz model (LHIER) and compare against the results provided by [20]. The aim of this is proving the effectiveness of our Lorentzian AdamW optimizer, general optimization scheme, curvature learning, and max distance scaling.
\ Experimental Setup We follow the experimental setup in Kim et al. [20] and rely on four main datasets: CUB-200- 2011 (CUB)[42], Cars-196 (Cars)[22], Stanford Online Product (SOP)[34], and In-shop Clothes Retrieval (InShop)[24]. Performance is measured using Recall@k which is the fraction of queries with one or more relevant samples in their k-nearest neighbors. Additionally, all model backbones are pretrained on Imagenet to ensure fair comparisons with the previous work.
\ 
\ Moving to Lorentz Space We adapt the HIER to the hyperboloid using three major changes. We first replace the Euclidean linear layer with a Lorentzian linear layer in the model neck and implement our max distance scaling operation after. We then set the hierarchical proxies as learnable hyperbolic parameters and optimize them directly on the manifold using our Lorentzian AdamW. Finally, we change the Poincaré distance to the Lorentz distance for the LHIER loss and set the hierarchical proxies to be scaled beforehand. We also continue to use on fp16 precision which shows our model is more robust to stability and imprecision issues.
\ Results As show in table 1, our HIER+ model manages to improve performance in almost all scenarios. However, the percentage change varies depending on the dataset and the model used. While we do the best in the case of Resnet models, we are particularly worse for the DeiT model, especially at the higher dimensionality where our method is out performed in most datasets by HIER. This could be the issue of a lack of hyperparameter tuning, specifically in the case of the tanh scaling; the s factor which controls the tightness of the outputs. Kim et al. [20] control this through the use of norm clipping with varying intensities, a similar approach could be adopted to study the best-fitting scaling factors given the experimental settings.
4.2 Standard Classification Problem
Experimental Setup We follow the experimental setup of Bdeir et al. [1] and rely on three main datasets: CIFAR10, CIFAR100, Mini-Imagenet. We also extend the experiments to include Resnet50, however, due to the increased memory cost, we are only able to compare to the base Euclidean counterpart and hybrid models. For the Resnet-18 models we do no use our Lorentz core blocks and instead recreate the hybrid encoder similar to Bdeir et al. [1]. For all models, we use the efficient convolutional layer, all hyperbolic vectors are scaled using our max distance rescaling with s = 2. Additionally, curvature learning is performed for both our Resnet-18 and Resnet-50 using Riemannian SGD with our fixed schema.Encoder and decoder manifolds are separated with each capable of learning its own curvature for better flexibility.
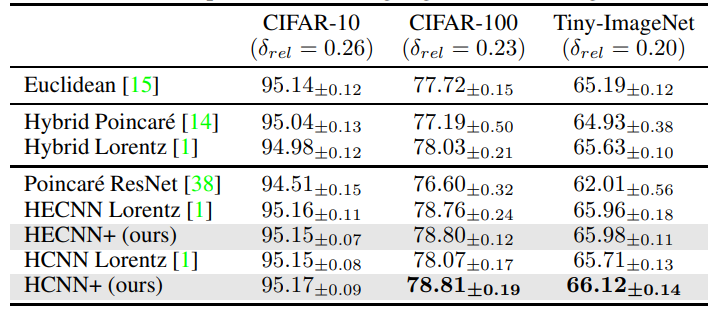
\ Results For Resnet-18 tests, we see in table 2 that the new architectures perform better in all scenarios. The smallest performance was mainly seen between the hybrid models, this could generally be because the hyperbolic bias played by the additional hyperbolic components is not as prominent as in a fully hyperbolic model. This could lead to the model benefiting less from the proposed changes. We can verify this through the bigger gap in performance between the fully hyperbolic models where our proposed model sees a 74% lift in accuracy and even matches the hybrid encoders in this scenario. To study this we looked at the new curvature learned by the encoder and found that it tended towards approximately -0.6 resulting in a flatter manifold.
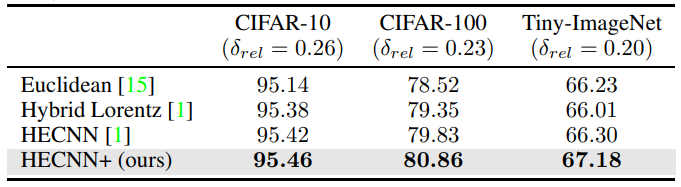
\ As for the Resnet-50 tests, we see in table 3, that HECNN+ is now able to greatly outperform the Euclidean model across all datasets as well. Even in the case of Tiny-Imagenet where other model accuracies begin to break down. This is probably due to the more fluid integration of hyperbolic elements and the extensive scaling to help deal with higher dimensional embeddings.
\ ![Table 1: Performance of metric learning methods on the four datasets as provided by [20]. All architecture backbones are pretrained and tested with the new LHIER loss. Superscripts denote their embedding dimensions and † indicates models using larger input images. As in [20], network architectures are abbreviated as, R–ResNet50 [15], B Inception with BatchNorm [17], De–DeiT [37], DN–DINO [2] and V–ViT [7]](https://cdn.hackernoon.com/images/null-bi0325o.png)
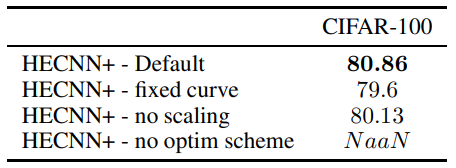
\ Ablation We test the effect of individual model components in table 5. Each subsequent model involves the default architecture presented in the experimental setup minus the mentioned component. As we can see, the best results are achieved when all the architectural components are included. In the case of attempting to learn the curvature without the proposed optimizer schema, the model breaks completely down due to excessive numerical inaccuracies. One other benefit that we find from learning the curvature is quicker convergence. The model is able to reach convergence in 130 epochs vs the 200 epochs required by a static curve model.
\ 
\ 
\ 
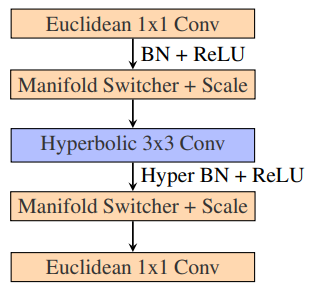
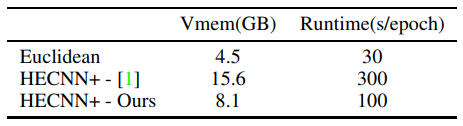
\ We then study the effectiveness of our efficient convolution in table 4. We see a ∼ 48% reduction in memory usage and ∼ 66% reduction in runtime. We attribute this improvement to the efficient closed-source convolution operations we can now leverage. However, there is still much room for improvement compared to the euclidean model. We identify the batchnorm operation as the new memory and runtime bottleneck accounting for around 60% of the runtime and around 30% of the memory. Factorizing the many parallel transports and tangent mappings required for this operation would be the next step in mitigating this issue.
\ 
\
5 Conclusion
In our work, we present many new components and schemas for the use of hyperbolic deep learning in hyperbolic vision. We present a new optimizer schema that allows for curvature learning, a tanh scaling to prevent numerical precision issues, a Riemannian Adam Optimizer, and efficient formulations of existing convolutional operations. We test these components in two different problem scenarios, hierarchical metric learning and classification, and prove the potential of these new components even in float16 conditions which are notoriously unstable for hyperbolic models.
\ However, there is still much progress to be made. The scaling operations provide a general method of keeping the embeddings within the representative radius but it could also be used for norm clipping. A study has to be done on the effect of embedding bounding for hyperbolic models as it has shown to be beneficial before [14, 20]. Additionally, more efficiency can still be gained from hyperbolic models through further optimizations to the batch normalization layers. Finally, there is still the issue of the hyperbolic feedforward layer when going from higher to lower dimensionality. We currently match norms to ensure a rotation operation but we encourage finding alternate approaches that are better conforming to the manifold mathematics.
References
[1] A. Bdeir, K. Schwethelm, and N. Landwehr. Fully hyperbolic convolutional neural networks for computer vision, 2024.
\ [2] M. Caron, H. Touvron, I. Misra, H. Jégou, J. Mairal, P. Bojanowski, and A. Joulin. Emerging properties in self-supervised vision transformers. In Proc. IEEE International Conference on Computer Vision (ICCV), 2021.
\ [3] W. Chen, X. Han, Y. Lin, H. Zhao, Z. Liu, P. Li, M. Sun, and J. Zhou. Fully hyperbolic neural networks, 2022.
\ [4] S. Chopra, R. Hadsell, and Y. LeCun. Learning a similarity metric discriminatively, with application to face verification. In Proc. IEEE Conference on Computer Vision and Pattern Recognition (CVPR), 2005.
\ [5] J. Dai, Y. Wu, Z. Gao, and Y. Jia. A hyperbolic-to-hyperbolic graph convolutional network, 2021.
\ [6] B. Dhingra, C. J. Shallue, M. Norouzi, A. M. Dai, and G. E. Dahl. Embedding text in hyperbolic spaces, 2018.
\ [7] A. Dosovitskiy, L. Beyer, A. Kolesnikov, D. Weissenborn, X. Zhai, T. Unterthiner, M. Dehghani, M. Minderer, G. Heigold, S. Gelly, et al. An image is worth 16x16 words: Transformers for image recognition at scale. In Proc. International Conference on Learning Representations (ICLR), 2021.
\ [8] A. El-Nouby, N. Neverova, I. Laptev, and H. Jégou. Training vision transformers for image retrieval. arXiv preprint arXiv:2102.05644, 2021.
\ [9] A. Ermolov, L. Mirvakhabova, V. Khrulkov, N. Sebe, and I. Oseledets. Hyperbolic vision transformers: Combining improvements in metric learning. In Proc. IEEE Conference on Computer Vision and Pattern Recognition (CVPR), 2022.
\ [10] O. Ganea, G. Becigneul, and T. Hofmann. Hyperbolic neural networks. In S. Bengio, H. Wallach, H. Larochelle, K. Grauman, N. Cesa-Bianchi, and R. Garnett, editors, Advances in Neural Information Processing Systems, volume 31. Curran Associates, Inc., 2018. URL https://proceedings.neurips.cc/paper/2018/file/dbab2adc8f9d078009ee3fa810bea142-Paper.pdf.
\ [11] W. Ge, W. Huang, D. Dong, and M. R. Scott. Deep metric learning with hierarchical triplet loss. In Proc. European Conference on Computer Vision (ECCV), 2018.
\ [12] F. D. Giovanni, G. Luise, and M. Bronstein. Heterogeneous manifolds for curvature-aware graph embedding, 2022.
\ [13] A. Gu, F. Sala, B. Gunel, and C. Ré. Learning mixed-curvature representations in product spaces. In International Conference on Learning Representations, 2018. URL https://api.semanticscholar.org/CorpusID:108328651.
\ [14] Y. Guo, X. Wang, Y. Chen, and S. X. Yu. Clipped hyperbolic classifiers are super-hyperbolic classifiers. In 2022 IEEE/CVF Conference on Computer Vision and Pattern Recognition (CVPR), pages 1–10, Los Alamitos, CA, USA, jun 2022. IEEE Computer Society. doi: 10.1109/CVPR52688.2022.00010. URL https://doi.ieeecomputersociety.org/10.1109/CVPR52688.2022.00010.
\ [15] K. He, X. Zhang, S. Ren, and J. Sun. Deep residual learning for image recognition. In Proc. IEEE Conference on Computer Vision and Pattern Recognition (CVPR), June 2016.
\ [16] K. Helfrich, D. Willmott, and Q. Ye. Orthogonal recurrent neural networks with scaled cayley transform, 2018.
\ [17] S. Ioffe and C. Szegedy. Batch normalization: Accelerating deep network training by reducing internal covariate shift. In Proc. International Conference on Machine Learning (ICML), 2015.
\ [18] V. Khrulkov, L. Mirvakhabova, E. Ustinova, I. Oseledets, and V. Lempitsky. Hyperbolic image embeddings. In Proc. IEEE Conference on Computer Vision and Pattern Recognition (CVPR), 2020.
\ [19] S. Kim, D. Kim, M. Cho, and S. Kwak. Proxy anchor loss for deep metric learning. In Proc. IEEE Conference on Computer Vision and Pattern Recognition (CVPR), 2020.
\ [20] S. Kim, B. Jeong, and S. Kwak. Hier: Metric learning beyond class labels via hierarchical regularization, 2023. [21] M. Kochurov, R. Karimov, and S. Kozlukov. Geoopt: Riemannian optimization in pytorch, 2020.
\ [22] J. Krause, M. Stark, J. Deng, and L. Fei-Fei. 3d object representations for fine-grained categorization. In Proceedings of the IEEE International Conference on Computer Vision Workshops, pages 554–561, 2013.
\ [23] M. Law, R. Liao, J. Snell, and R. Zemel. Lorentzian distance learning for hyperbolic representations. In K. Chaudhuri and R. Salakhutdinov, editors, Proceedings of the 36th International Conference on Machine Learning, volume 97 of Proceedings of Machine Learning Research, pages 3672–3681. PMLR, 09–15 Jun 2019. URL https://proceedings.mlr.press/v97/law19a.html.
\ [24] S. Liu, X. Qi, J. Shi, H. Zhang, and J. Jia. Multi-scale patch aggregation (MPA) for simultaneous detection and segmentation. In Proc. IEEE Conference on Computer Vision and Pattern Recognition (CVPR), 2016.
\ [25] S. Liu, J. Chen, L. Pan, C.-W. Ngo, T.-S. Chua, and Y.-G. Jiang. Hyperbolic visual embedding learning for zero-shot recognition. In 2020 IEEE/CVF Conference on Computer Vision and Pattern Recognition (CVPR), pages 9270–9278, 2020. doi: 10.1109/CVPR42600.2020.00929.
\ [26] I. Loshchilov and F. Hutter. Decoupled weight decay regularization, 2019.
\ [27] P. Mettes, M. G. Atigh, M. Keller-Ressel, J. Gu, and S. Yeung. Hyperbolic deep learning in computer vision: A survey, 2023.
\ [28] G. Mishne, Z. Wan, Y. Wang, and S. Yang. The numerical stability of hyperbolic representation learning, 2022. URL https://arxiv.org/abs/2211.00181.
\ [29] Y. Nagano, S. Yamaguchi, Y. Fujita, and M. Koyama. A wrapped normal distribution on hyperbolic space for gradient-based learning, 2019. URL https://arxiv.org/abs/1902.02992.
\ [30] Q. Qian, L. Shang, B. Sun, J. Hu, H. Li, and R. Jin. Softtriple loss: Deep metric learning without triplet sampling. In Proc. IEEE International Conference on Computer Vision (ICCV), 2019.
\ [31] E. Qu and D. Zou. Lorentzian fully hyperbolic generative adversarial network, 2022. URL https://arxiv.org/abs/2201.12825.
\ [32] E. Qu and D. Zou. Hyperbolic convolution via kernel point aggregation, 2023. [33] K. Roth, B. Brattoli, and B. Ommer. Mic: Mining interclass characteristics for improved metric learning. In Proc. IEEE International Conference on Computer Vision (ICCV), 2019.
\ [34] H. O. Song, Y. Xiang, S. Jegelka, and S. Savarese. Deep metric learning via lifted structured feature embedding. In Proc. IEEE Conference on Computer Vision and Pattern Recognition (CVPR), 2016.
\ [35] E. W. Teh, T. DeVries, and G. W. Taylor. Proxynca++: Revisiting and revitalizing proxy neighborhood component analysis. In European Conference on Computer Vision (ECCV). Springer, 2020.
\ [36] A. Tifrea, G. Bécigneul, and O.-E. Ganea. Poincaré glove: Hyperbolic word embeddings, 2018.
\ [37] H. Touvron, M. Cord, M. Douze, F. Massa, A. Sablayrolles, and H. Jégou. Training data-efficient image transformers & distillation through attention. In Proc. International Conference on Machine Learning (ICML), 2021.
\ [38] M. van Spengler, E. Berkhout, and P. Mettes. Poincaré resnet, 2023.
\ [39] J. Wang, Y. Song, T. Leung, C. Rosenberg, J. Wang, J. Philbin, B. Chen, and Y. Wu. Learning finegrained image similarity with deep ranking. In Proc. IEEE Conference on Computer Vision and Pattern Recognition (CVPR), 2014.
\ [40] X. Wang, X. Han, W. Huang, D. Dong, and M. R. Scott. Multi-similarity loss with general pair weighting for deep metric learning. In Proc. IEEE Conference on Computer Vision and Pattern Recognition (CVPR), 2019.
\ [41] X. Wang, H. Zhang, W. Huang, and M. R. Scott. Cross-batch memory for embedding learning. In Proc. IEEE Conference on Computer Vision and Pattern Recognition (CVPR), pages 6388–6397, 2020.
\ [42] P. Welinder, S. Branson, T. Mita, C. Wah, F. Schroff, S. Belongie, and P. Perona. Caltech-UCSD Birds 200. Technical Report CNS-TR-2010-001, California Institute of Technology, 2010.
\ [43] Z. Yang, M. Bastan, X. Zhu, D. Gray, and D. Samaras. Hierarchical proxy-based loss for deep metric learning. 2022.
\ [44] A. Zhai and H.-Y. Wu. Classification is a strong baseline for deep metric learning. arXiv preprint arXiv:1811.12649, 2018.
\ [45] Y. Zhu, D. Zhou, J. Xiao, X. Jiang, X. Chen, and Q. Liu. Hypertext: Endowing fasttext with hyperbolic geometry, 2021.
\
:::info Authors:
(1) Ahmad Bdeir, Data Science Department, University of Hildesheim ([email protected]);
(2) Niels Landwehr, Data Science Department, University of Hildesheim ([email protected]).
:::
:::info This paper is available on arxiv under CC by 4.0 Deed (Attribution 4.0 International) license.
:::
\
Ayrıca Şunları da Beğenebilirsiniz
![[OPINION] US National Security Strategy 2025: An iconoclastic document](https://www.rappler.com/tachyon/2025/12/AMERICANS-ARE-BACK-DEC-12-2025.jpg?resize=75%2C75&crop_strategy=attention)
[OPINION] US National Security Strategy 2025: An iconoclastic document

Crucial US Stock Market Update: What Wednesday’s Mixed Close Reveals
