

Index
Share
A crypto Index provides a way for investors to gain diversified exposure to a specific basket of digital assets through a single tokenized product. These indices often track specific sectors, such as DeFi, DePIN, or RWA, and are automatically rebalanced via smart contracts. In 2026, AI-managed thematic indices have become the gold standard for passive investing, allowing users to track the "blue chips" of the Web3 economy without manual portfolio management. This tag covers index methodology, rebalancing frequency, and the benefits of diversified crypto baskets.
25094 Articles
Created: 2026/02/02 18:52
Updated: 2026/02/02 18:52


Recommended by active authors

Latest Articles
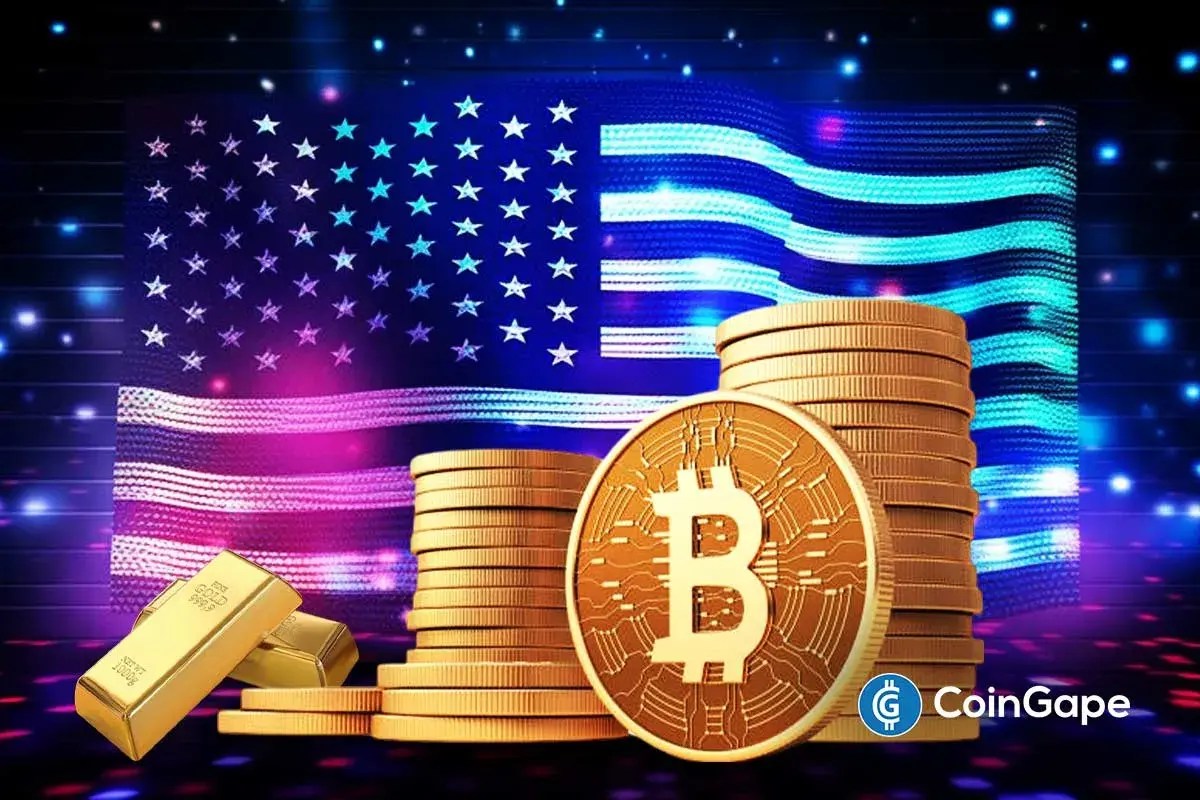
U.S. Treasury Rules Out BTC Buys as GOP Senators Push For Use Of Gold Reserves
2026/02/05 04:35
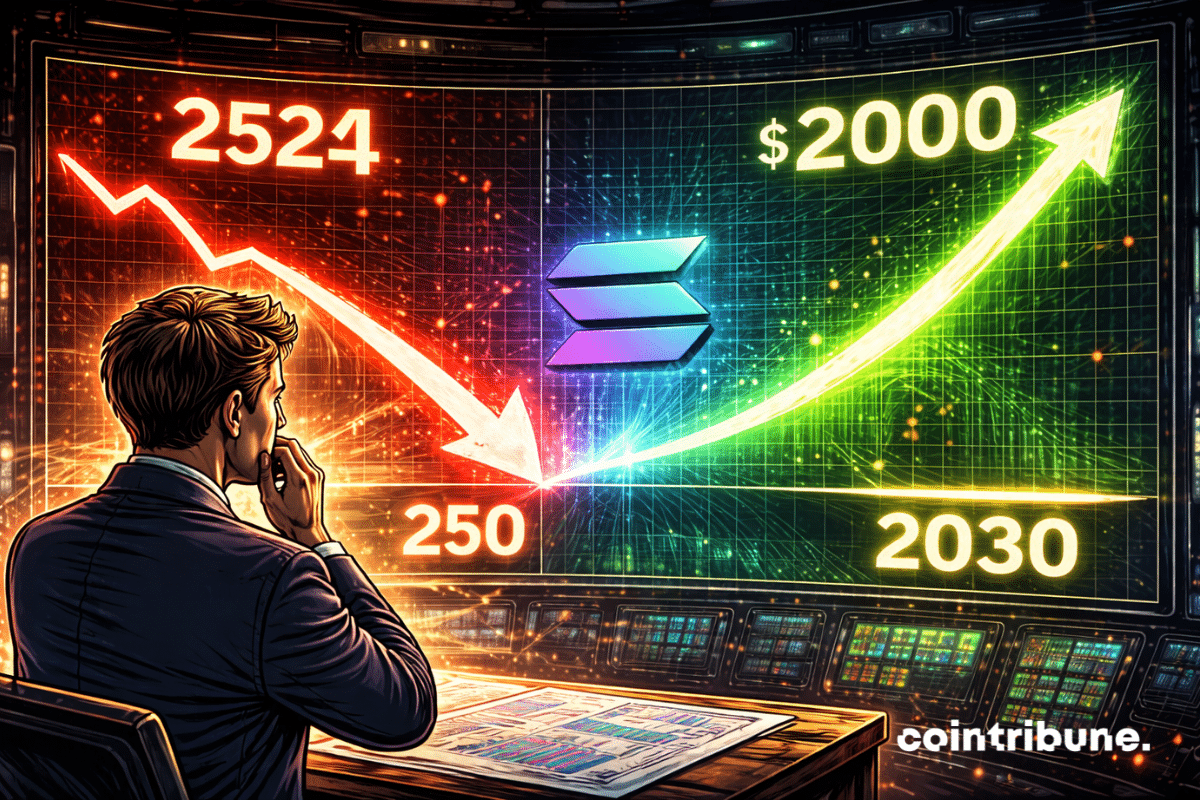
Solana To Hit $250 In 2026 ? Bank Explains Why
2026/02/05 04:05

Securities Fraud Investigation Into Corcept Therapeutics Incorporated (CORT) Announced – Shareholders Who Lost Money Urged To Contact Glancy Prongay Wolke & Rotter LLP, a Leading Securities Fraud Law Firm
2026/02/05 04:00

This is Trump's plot to rig the midterms — we must unite to beat it
2026/02/05 03:57

Over 80% of 135 Ethereum L2s record below 1 user operation per second
2026/02/05 03:52